
Figure 3.
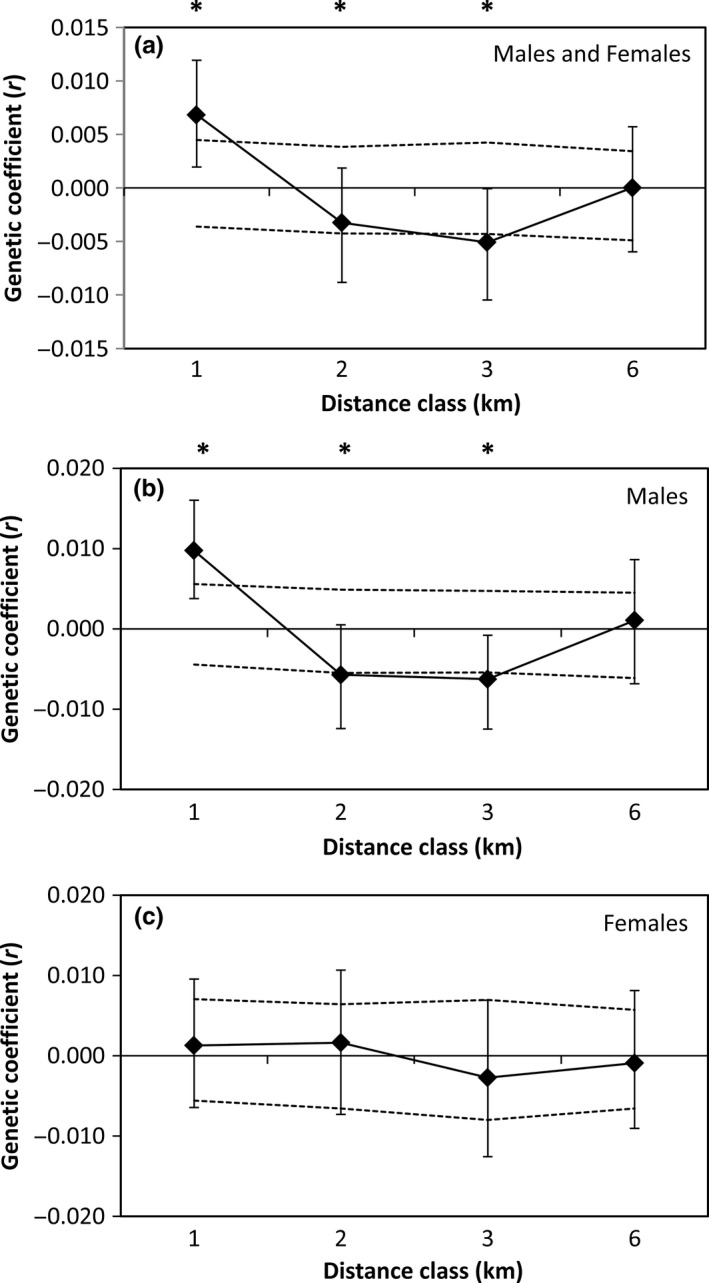
Correlograms showing the spatial genetic autocorrelation (r) with the designated distance classes for (a) males and females combined, (b) males only, and (c) females only. Male Rufous‐and‐white Wrens were more genetically similar at the closest distance class, but became more dissimilar at distances of 2 and 3 km. By comparison, females exhibited no significant genetic structure at any of the four distance classes. Dashed black lines represent the 95% upper and lower confidence limits determined using bootstrapping. Asterisks denote the distance classes where song sharing was significantly higher or lower from what was expected by chance (p < .05)