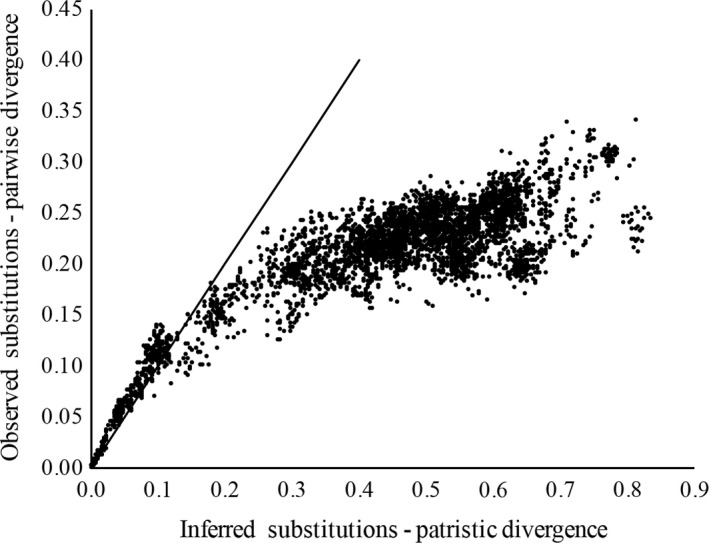
Figure 2.

COI saturation plot. Saturation is assessed by comparing observed substitutions [pairwise uncorrected p distances (Y‐axis)] with Bayesian model‐corrected distances (X‐axis). The solid line has a slope of 1 and is a theoretical representation of sequence data that would occur if there was no saturation (Jeffroy et al., 2008). The observed departure from this theoretical slope (which occurs at around 0.15 substitutions per site in this data set) suggests that saturation has occurred
