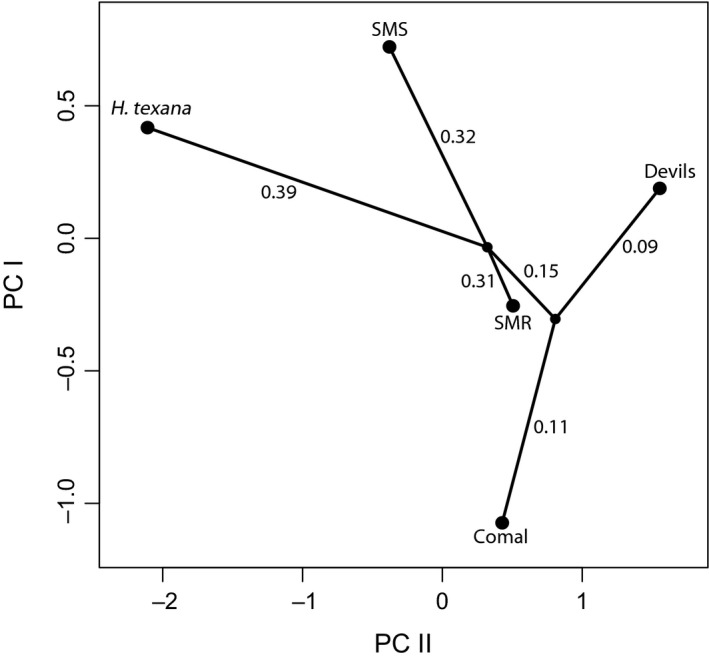
Figure 4.

Phylomorpho plot of population centroids with phylogenetic relationship. Genetic similarity is not related to distribution of centroids in principal components analysis space. Decimals along branches represent the Bayesian model inferred number of substitutions
