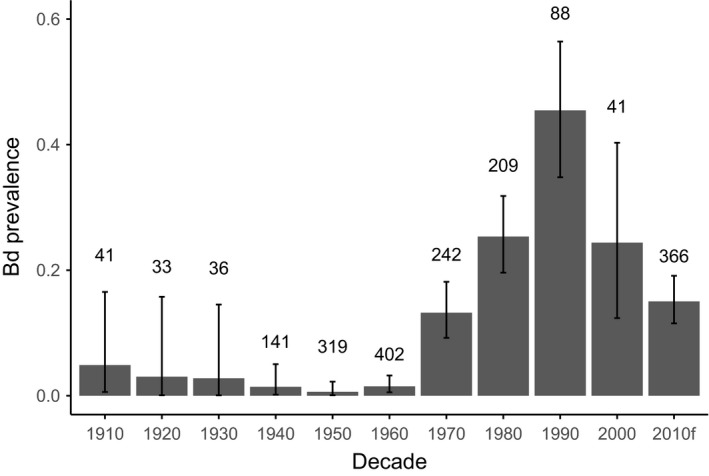
Figure 2.

Bd prevalence through time for all museum specimens sampled. Each bar represents a decade that begins with the year indicated by the x‐axis label. Error bars represent Clopper–Pearson binomial confidence intervals. Numbers above the bars denote sample size. Data are from specimens collected from the study area, including Los Angeles, Ventura, and San Luis Obispo, and Santa Barbara counties. The “2010f” category represents Bd samples collected from live postmetamorphic amphibians sampled in the field from 2011 to 2014
