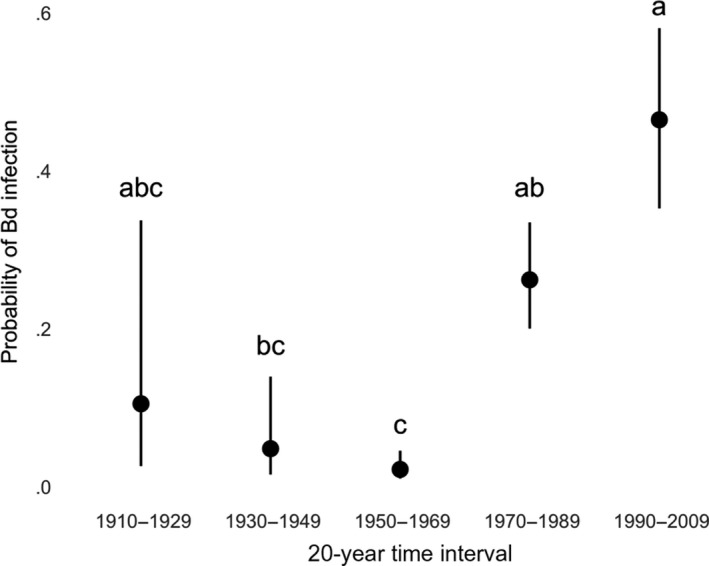
Figure 5.

Probability of Bd infection for 20‐year time intervals as indicated by the best‐fit generalized linear model of museum specimen samples. Error bars indicate 95% confidence intervals. Letters above the bars indicate Tukey groups for 20‐year time intervals from the best‐fitting model of Bd presence/absence in all species: Time intervals that do not share a letter are significantly different from one another
