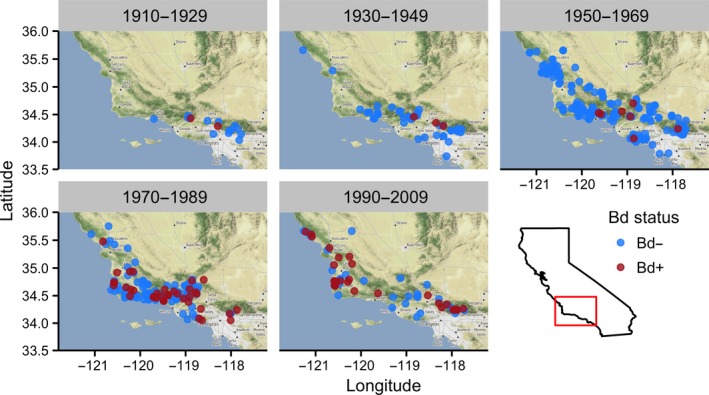
Figure 6.

Map of localities sampled for Bd in museum specimens from 1915 to 2009 as used in the generalized linear model. Dates above each map represent the 20‐year time interval in which each specimen was collected. Data were arranged prior to mapping so that Bd‐positive samples would be superimposed on Bd‐negative samples when they overlapped. Data include sampled specimens collected from Ventura, Santa Barbara, Los Angeles, and San Luis Obispo counties
