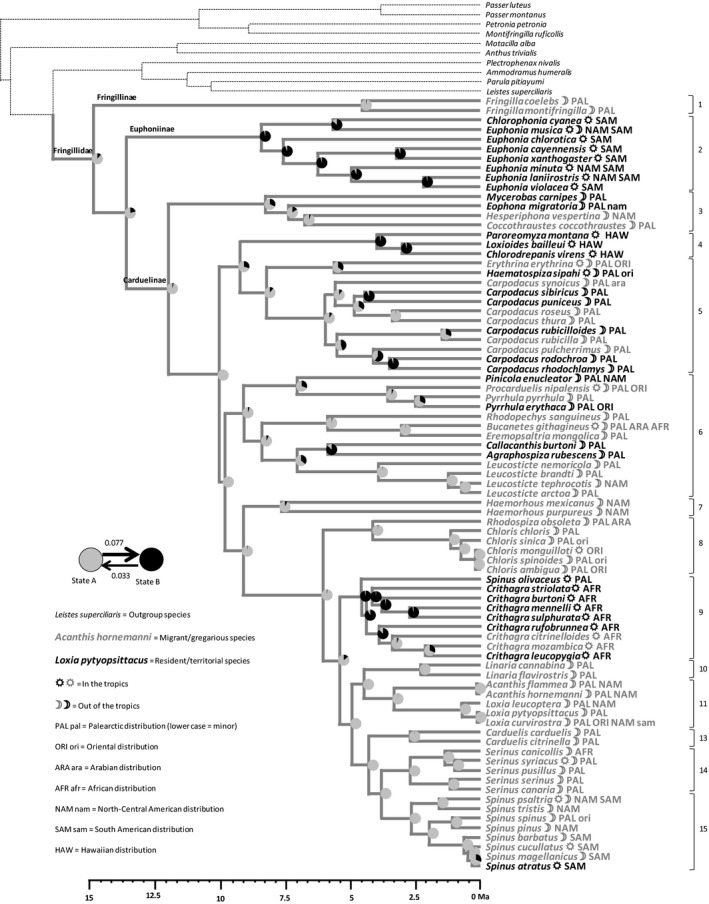
Figure 5.

Reconstruction by maximum‐likelihood inference of the ancestral state of the dispersal/social behavioral syndrome, using the distribution of species in two groups (see Fig. S1d). Dispersiveness/gregariousness (state A) is in gray while residence/territoriality (state B) is in black. At each node of the phylogenetic tree, a pie chart indicates the confidence given to residence/territoriality or dispersiveness/gregariousness as the ancestral state. Otherwise as for Figure 2
