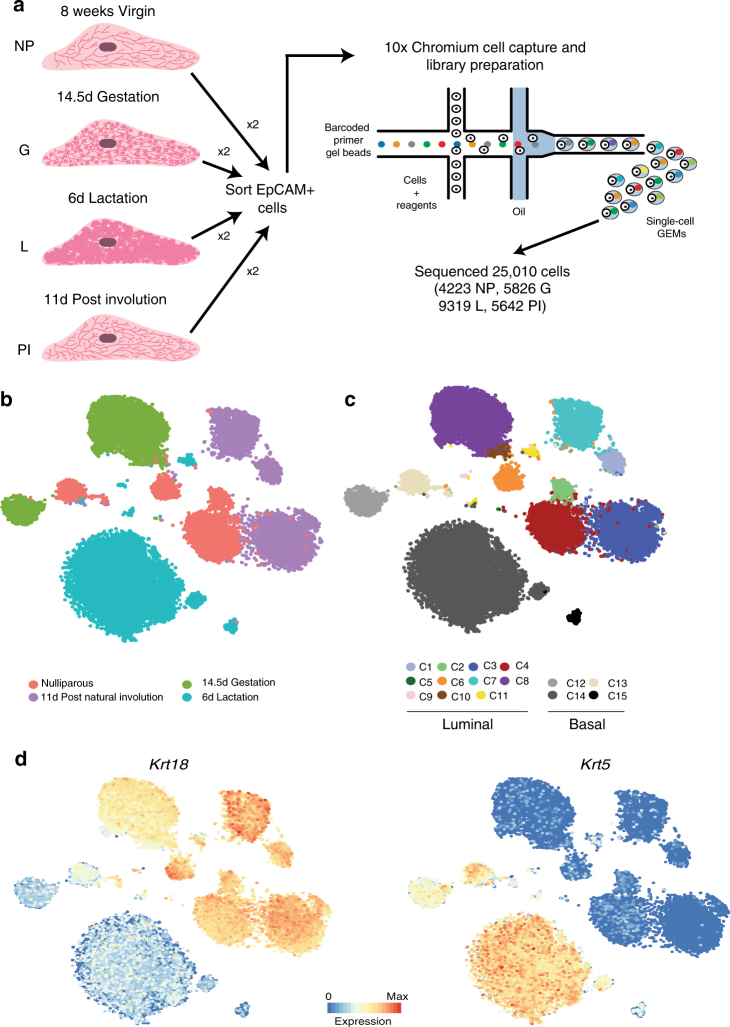
Fig. 1.
Single-cell RNA sequencing identifies 15 clusters of mammary epithelial cells. a Schematic diagram highlighting the experimental setup for isolating and sequencing the RNA of single cells using the 10× chromium system. b t-SNE plot of 23,184 cells visualises general structure in the data. Cells are coloured by the four developmental time points as follows: pink = NP, dark green = G, light green = L, purple = PI. c Same as b but colouring cells by clusters. d t-SNEs coloured by the normalised log-transformed expression of the basal marker Krt5 and the luminal marker Krt18

