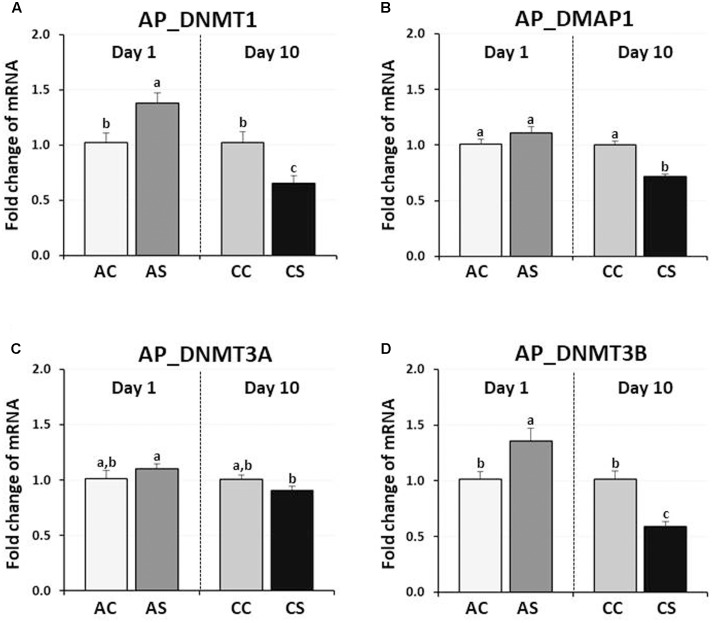
FIGURE 2.
Differential changes in expression of DNA methyltransferases (DNMT1, DNMT3A, and DNMT3B) and DNMP1 in the anterior pituitary gland by acute or CS. Total RNA from the anterior pituitary was extracted after 1 h acute and after 10 consecutive days of 1 h CS. Relative mRNA levels of DNA methyltransferases were quantified and data were set as fold changes of relative expression levels using the ΔΔCt method with GAPDH and β-actin as internal controls. Data (mean ± SEM) were expressed from a value set for 1.0 for the (AC) for each gene. Different lower-case letters above the bars denote significant differences (P < 0.05) among groups, where a > b > c and a,b is not different from a or b. DNMT1, DNA methyltransferase 1; DMAP1, DNA methyltransferase 1 associated protein 1; DNMT3A, DNA methyltransferase 3 alpha; DNMT3B, DNA methyltransferase 3 beta; AC, acute control; AS, acute stress; CC, chronic control; CS, chronic stress.

