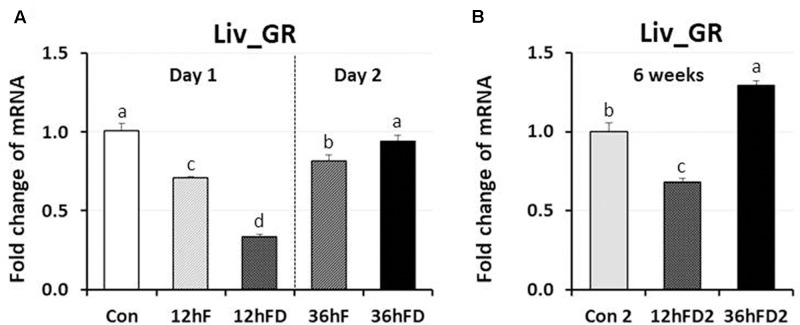
FIGURE 5.
Differential changes in expression of glucocorticoid receptor in the liver (Liv) by 12 h or 36 h FD (nutritional stress) during the neonatal period. (A) Total RNA from the Liv was extracted from birds after treatments of 12 h or 36 h FD following post-hatching (Days 1 and 2). Five groups include 0 h controls (Con), 12 h fed controls (12hF), 12 h FD (12hFD), 36 h fed controls (36hFD), and 36 h FD birds (n = 14birds/group). (B) At 6 weeks of age, Liv was sampled from birds which were treated by 12hFD and 36hFD following post-hatching (Days 1 and 2). Birds given food and water ad libitum from day 1 through week 6 served as controls (Con2). Relative mRNA levels were quantified and data were set as fold changes of relative expression levels using the ΔΔCt method with GAPDH and β-actin serving as internal controls. Data (mean ± SEM) were expressed from a value set for 1.0 for the 0 h controls (Con) for each gene. Different lower-case letters above the bars denote significant differences (P < 0.05) among groups, where a > b > c > d. DNMT1, DNA methyltransferase 1; DMAP1, DNA methyltransferase 1 associated protein 1; DNMT3A, DNA methyltransferase 3 alpha; DNMT3B, DNA methyltransferase 3 beta.

