
Figure 2.
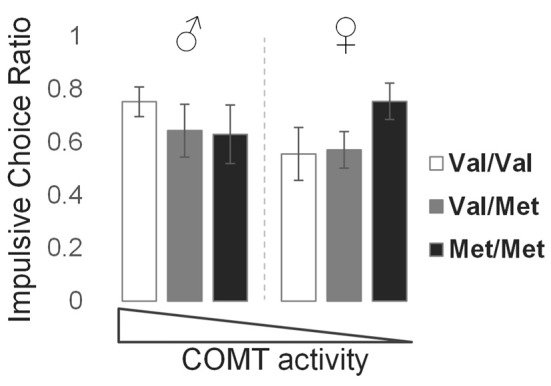
Effects of COMT genotype and sex on impulsive choice during a delay discounting task. Bar graphs represent the mean and standard error of impulsive choice ratio (ICR) values for each group, in order of theoretical frontal dopamine levels.
Official websites use .gov
A
.gov website belongs to an official
government organization in the United States.
Secure .gov websites use HTTPS
A lock (
) or https:// means you've safely
connected to the .gov website. Share sensitive
information only on official, secure websites.
Effects of COMT genotype and sex on impulsive choice during a delay discounting task. Bar graphs represent the mean and standard error of impulsive choice ratio (ICR) values for each group, in order of theoretical frontal dopamine levels.