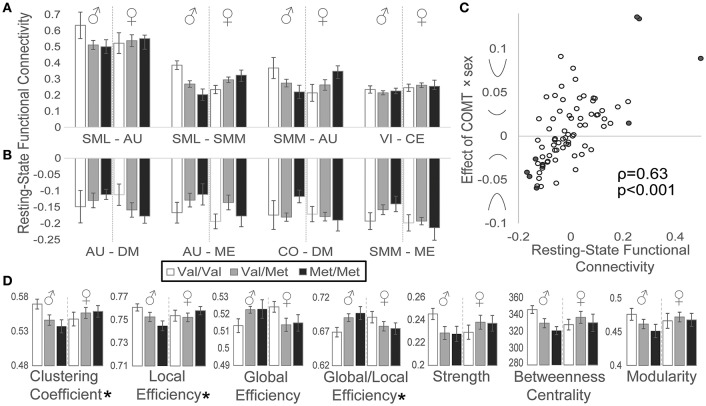
Figure 4.
Effects of COMT genotype and sex on functional connectivity during a resting state. Between-network functional connectivity is plotted by COMT genotype and sex for the (A) four most positive and (B) four most negative connections. For display purposes, between-network connectivity was plotted as the averaged Fisher-z-transformed correlation between all ROIs belonging to each pair of networks. Error bars reflect standard errors of the means. (C) Scatter plot of resting-state functional connectivity plotted against COMT genotype × sex interaction effects for each network pair. Symbols on the y-axis correspond with the direction of interaction effects, producing u-shaped (positive values) or inverted u-shaped (negative values) relationships. Filled circles indicate network connections highlighted in panels A and B. (D) Graph theory measures are plotted by COMT genotype and sex. (*) Denotes statistically significant COMT genotype × sex interaction effect measured at the network level. Error bars reflect standard errors of the means. AU, auditory; CE, cerebellar; CO, cingulo-opercular task control; DM, default mode; ME, memory retrieval; SML, lateral sensorimotor; SMM, medial sensorimotor; VI, visual.

