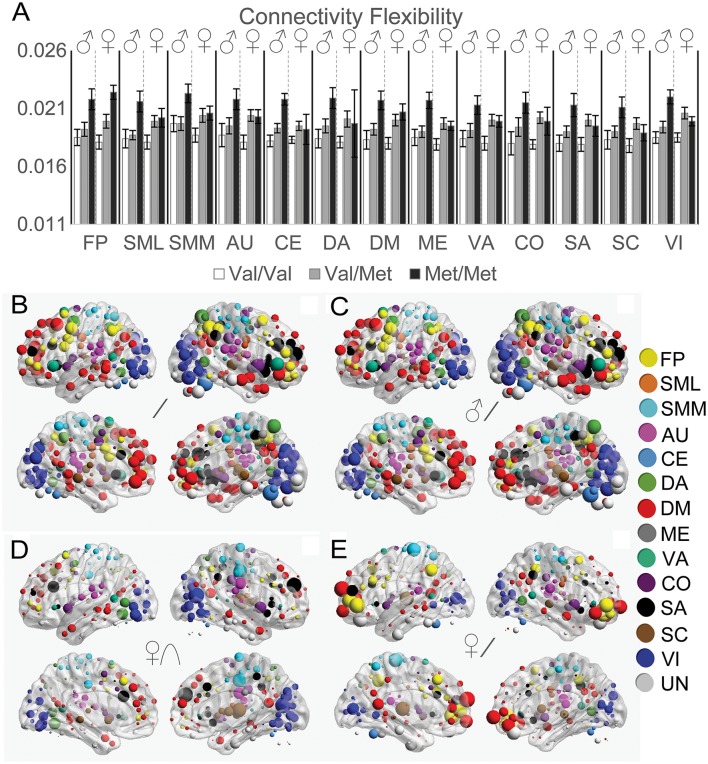
Figure 5.
Effects of COMT genotype and sex on functional connectivity flexibility between resting and task states. (A) Functional connectivity flexibility is plotted by COMT genotype and sex for each large-scale network. For display purposes, connectivity flexibility was averaged across all ROIs in a given network. Error bars reflect standard errors of the means. The strength of COMT genotype effects for each of the 264 ROIs is displayed on left and right cerebral hemispheres according to statistical tests of (B) linear effects across all subjects, controlling for sex, (C) linear effects in males, (D) quadratic effects in females, and (E) linear effects in females. The size of the spheres correspond with the size of the COMT genotype effects, scaled independently for each of the image sets in (B–E). AU, auditory; CE, cerebellar; CO, cingulo-opercular task control; DM, default mode; DA, dorsal attention, FP, fronto-parietal task control; ME, memory retrieval; SA, salience; SML, lateral sensorimotor; SMM, medial sensorimotor; SC, subcortical; VA, ventral attention; VI, visual.

