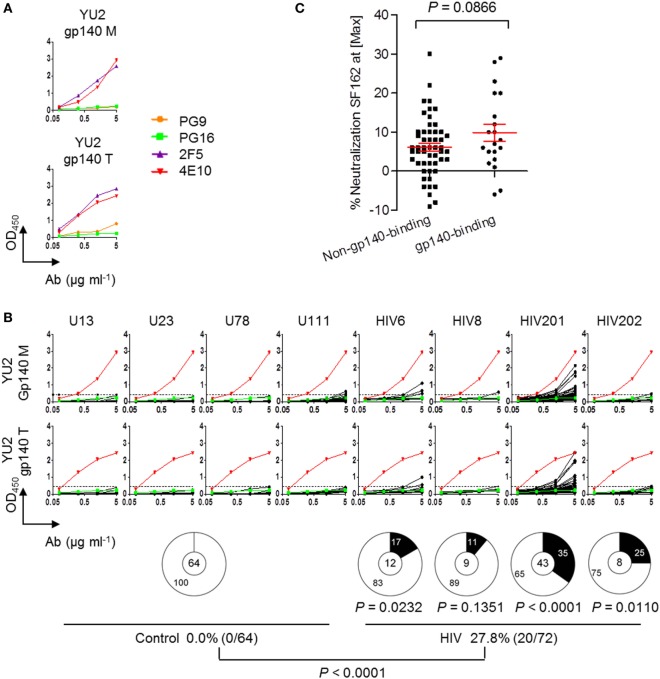
Figure 1.
Circulating plasmablasts in chronically HIV-infected individuals producing low-affinity anti-gp140 antibodies (Abs). (A) ELISA results of known bnAbs (PG9, PG16, 4E10, and 2F5) against YU2 gp140 monomer and trimer. (B) ELISA results of the recombinant monoclonal antibodies (mAbs) derived from the plasmablasts of control and HIV-infected individuals binding to YU2 gp140 monomer and trimer. The dashed line represents the cut-off OD450nm value for positive reactivity by the anti-gp140 test, which is 3 SEM above the average reactivity of control Abs. Each line with four dots represent individual Ab tested upon four serial dilutions. Green lines represent PG16 as the negative control. Red lines represent 4E10 as the positive control. Pie graphs show percentages of gp140-binding Abs in the control Ab pool and in each HIV-infected subject. Digits in pie centers represent total numbers of mAbs cloned from each individual. Digits in pie outer regions represent percentages of mAbs that are reactive with gp140 (black) and not reactive with gp140 (white). The bottom panel summarizes total frequencies of anti-gp140 Abs in four healthy controls and four HIV-infected individuals. P-value was determined by Mann–Whitney test. (C) Comparison of percentages of neutralized virus (SF162) at max concentration of Ab (50 μg/mL) applied in TZM-bl assay between non-anti-gp140 and anti-gp140 Abs. P-value was determined by unpaired t-test.

