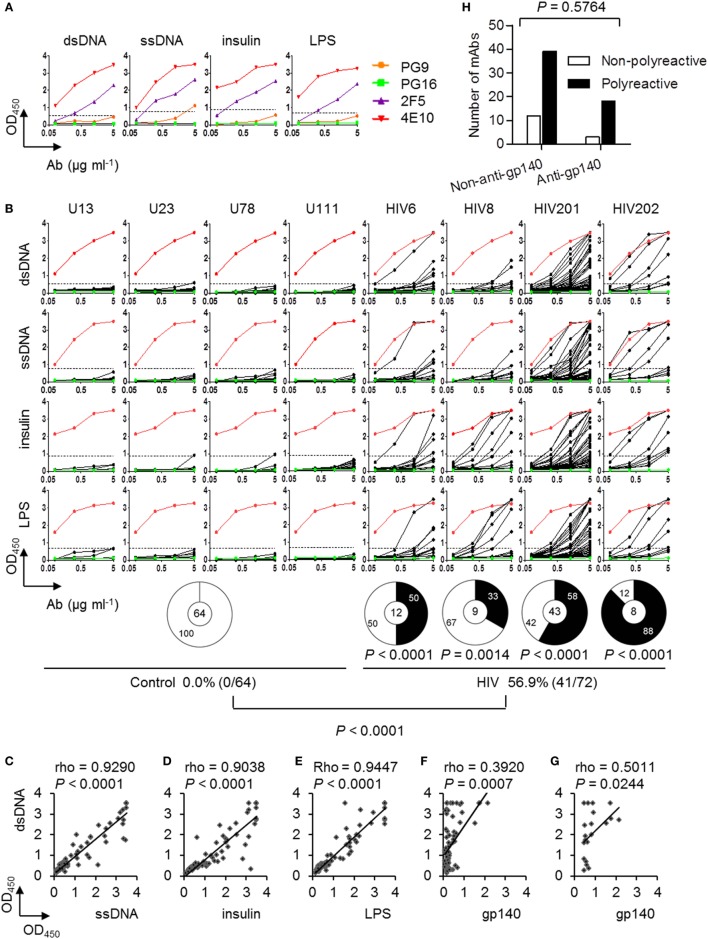
Figure 2.
Polyreactivity of monoclonal antibodies (mAbs) cloned from circulating plasmablasts of control and chronically HIV-infected individuals. (A) ELISA results of known bnAbs (PG9, PG16, 4E10, and 2F5) against double-stranded DNA (dsDNA), single-stranded DNA (ssDNA), insulin, and lipopolysaccharide (LPS). (B) ELISA results of each recombinant mAbs derived from plasmablasts of control and HIV-infected individuals against dsDNA, ssDNA, insulin, and LPS. Red lines represent 4E10, as the positive control. Green lines represent PG16, as the negative control. Dashed lines represent the cut-off OD450nm value for positive reactivity, which is 3 SEM above the average reactivity of control Abs. Pie charts summarize the frequency of polyreactive (black) and non-polyreactive (white) Abs. The percentages of polyreactive Abs in control and HIV-positive group are summarized in the bottom panel. P-values are in comparison with pooled Abs derived from the control donors. P-value was determined by Fisher’s exact test. (C–G) Correlations of the anti-dsDNA reactivities of the 72 recombinant mAbs from HIV-infected individuals with their reactivities against ssDNA (C), insulin (D), LPS (E), and gp140 (F). (G) Correlations of the anti-dsDNA reactivities with gp140-binding Abs only. rho and P-values were determined by Spearman’s ranked correlation test. (H) Numbers of non-polyreactive Abs among non-anti-gp140 and anti-gp140 Abs compared with polyreactive Abs. P-value was determined by chi-squared test.

