Figure 4.

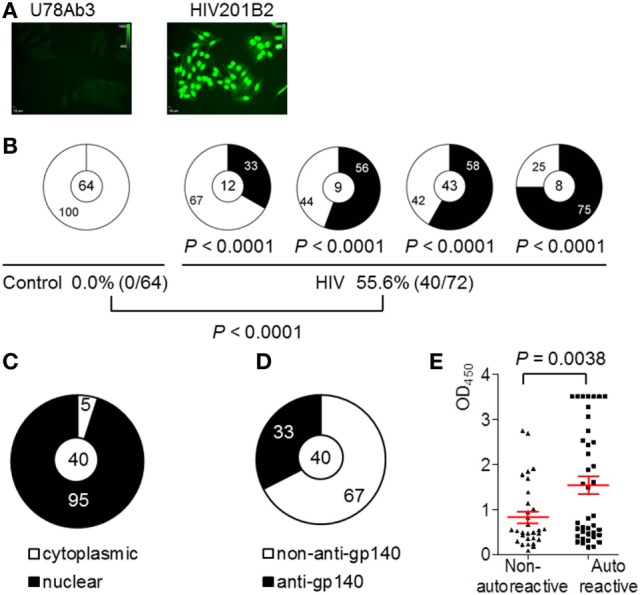
Autoreactivity of monoclonal antibodies (mAbs) cloned from circulating plasmablasts of control and chronically HIV-infected individuals. (A) Representatives of autoantibodies (ANA) patterns of non-autoreactive Ab U78Ab3 from control and autoreactive Ab HIV201B2 from patient (scale bar: 10 µm). (B) Shown are pie charts summarizing the frequencies of autoreactive (black) and non-autoreactive (white) Abs. The percentages of ANAs in control and HIV-positive group are summarized in the bottom panel. (C) Shown is pie graph summarizing the percentages of nucleus- (black) and cytoplasmic-reactive (white) Abs in total of 40 ANAs.(D) Shown is pie graph summarizing the percentage of gp140-binding Abs (black) and non-gp140-binding Abs (white) in total of 40 ANAs. (E) Comparison of OD450nm values in dsDNA-ELISA between ANAs and non-ANA. Red error bars indicate mean with SEM.
