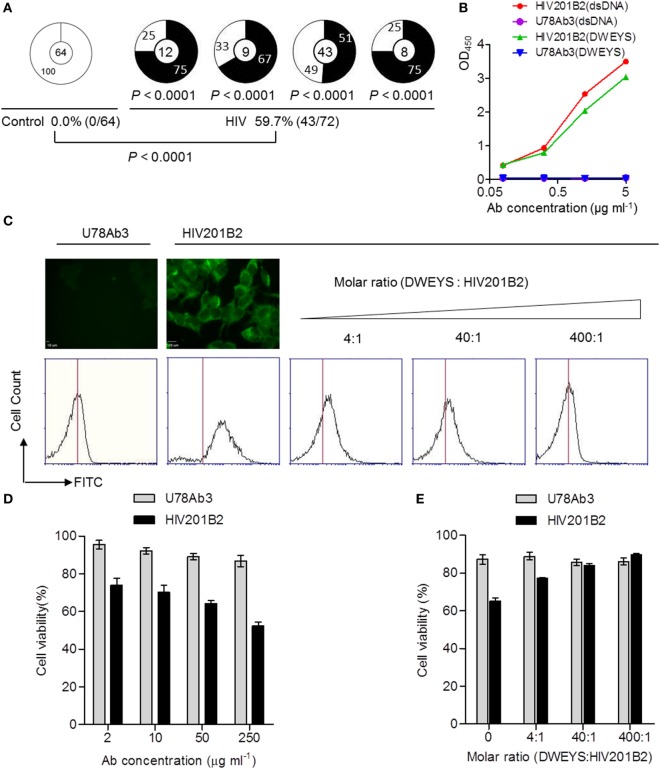
Figure 5.
NMDAR-cross-reactivity and effect on SH-SY5Y cell viability of monoclonal antibodies (mAbs) cloned from circulating plasmablasts of chronically HIV-infected individuals. (A) Shown are pie charts summarizing the frequencies of DWEYS-cross-reactive Abs (black) and Abs without DWEYS-cross-reactivity (white). P-values are in comparison with pooled Abs derived from the control donors. The percentages of DWEYS-cross-reactive Abs in control and HIV-positive group are summarized at the bottom. (B) DWEYS- and dsDNA-ELISA-binding curves of two mAb representatives: U78Ab3, double negative, and HIV201B2, double positive. (C) The top-left panel shows the staining of HIV201P5B2 on the membrane of SH-SY5Y cells (scale bar: 10 µm). Histograms show the competitive binding of DWEYS to HIV201B2. Blank bars show (D) the decreasing cell viability as the concentration of HIV201B2 applied to treat SH-SY5Y cells goes up and (E) the increasing cell viability as the molar ratio of DWEYS to HIV201B2 applied to treat SH-SY5Y cells goes up. Gray bars show U78Ab3 as the control. Error bars indicate mean with SD.

