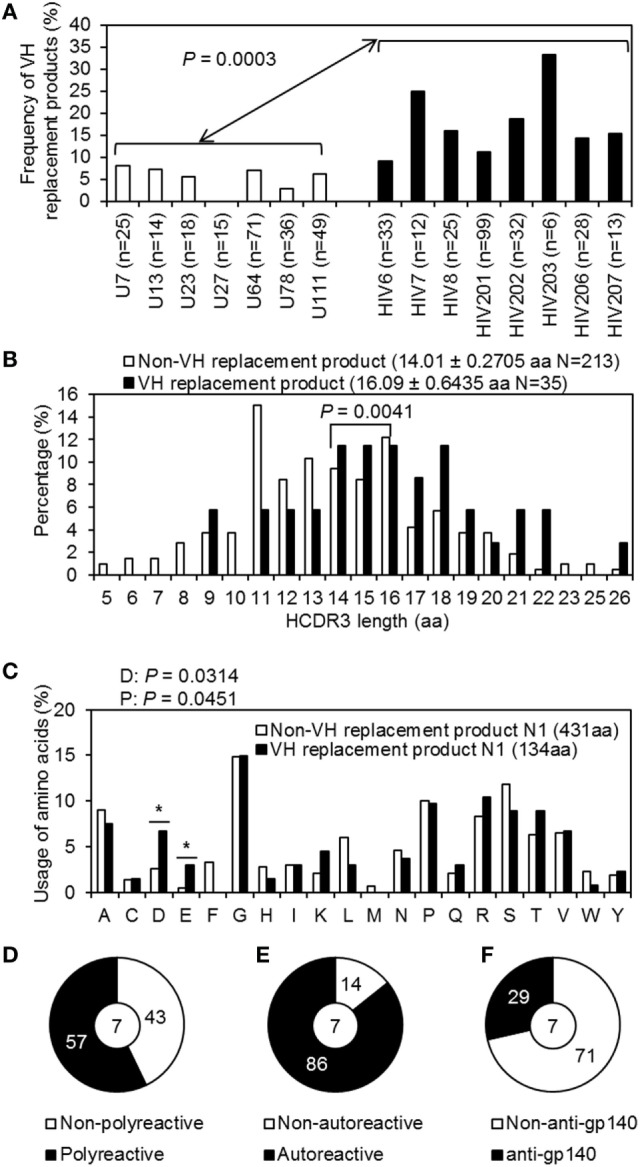
Figure 7.

VH replacement analyses of Ig heavy (IgH) genes derived from plasmablasts of control and chronically HIV-infected individuals. (A) Shown is bar graph summarizing the frequencies of VH replacement products in IgH gene sequences derived from plasmablasts of each control donor (white bars) and HIV-infected individual (black bars). (B) Comparison of the IgH CDR3 lengths of non-VH replacement products (white bar; average ± SD: 14.01 ± 0.2705 aa) and VH replacement products (black bar; average ± SD: 16.05 ± 0.6439 aa). (C) Bar graph shows the frequency of aa contributed by the identified VH replacement footprints versus that in the N1 regions of non-VH replacement products. (D–F) Pie graphs show the percentage of polyreactive (D) autoreactive (E) and anti-gp140 (F) Abs encoded by VH replacement products.
