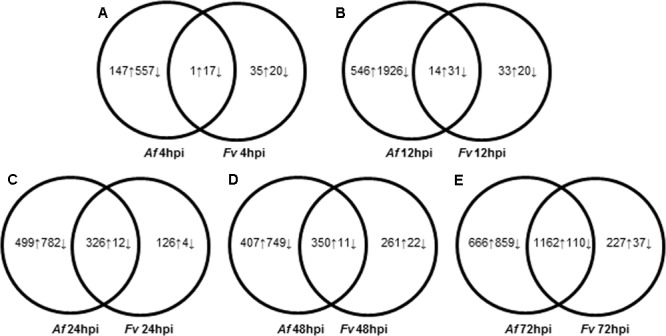
FIGURE 2.

Dynamic changes of kernel transcriptome during A. flavus (Af) and F. verticillioides (Fv) infection. (A–E) Show total numbers of maize genes differentially expressed in response to A. flavus and F. verticillioides infection at 4 (A), 12 (B), 24 (C), 48 (D), and 72 (E) hours post inoculation (hpi). Total numbers of up (↑) and down (↓)-regulated genes of treatment-specific and shared between treatments are displayed in Venn diagrams.
