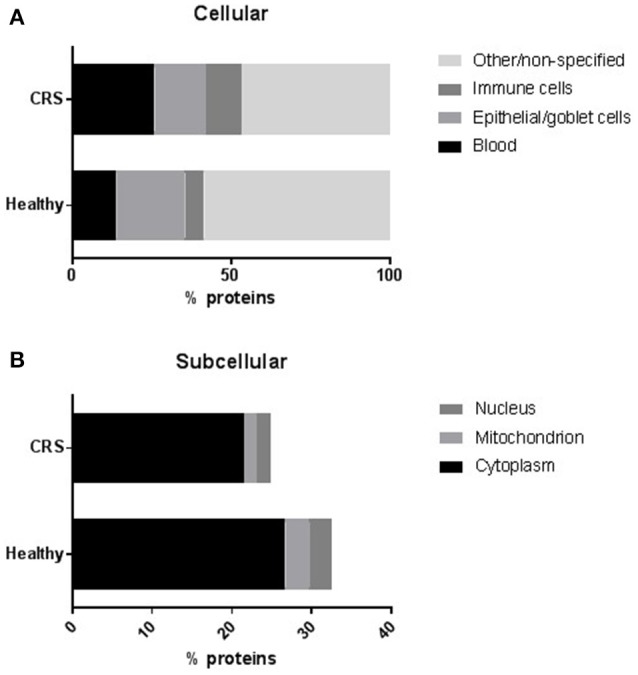
Figure 1.

The distribution of proteins at (A) cellular and (B) subcellular levels. The number of proteins within each group were averaged and represented as a percentage of total proteins. Proteins that could not be assigned to the chosen categories or were non-specified on the protein databases were placed into a separate “other/non-specified” group in (A). Proteins originating from blood or epithelial/goblet cells were differentially regulated (p < 0.05, t-test) in the CRS and healthy cohorts. At a subcellular level (B), significantly fewer proteins originated from the nucleus and mitochondrion of CRS patients compared with healthy controls.
