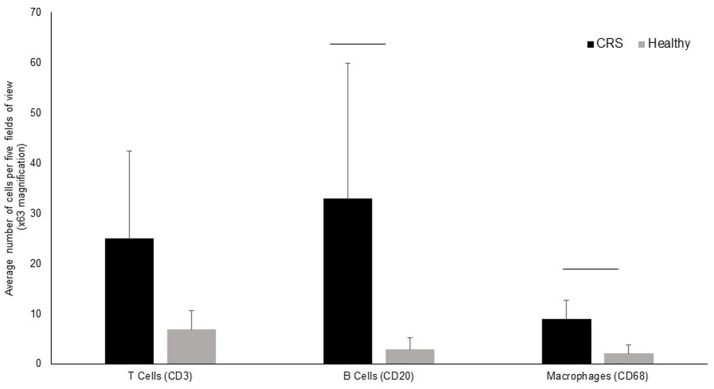
Figure 3.
Enumeration of immune cells in middle meatus tissue of CRS (n = 9) and healthy (n = 5) individuals. The average number of T-cells, B-cells and macrophages are represented in the bar graphs along with standard deviation. Although cells were elevated in all three cell types, significant differences (p < 0.05 represented by a horizontal bar) between CRS and healthy cohorts was only observed for B-cells and macrophages.

