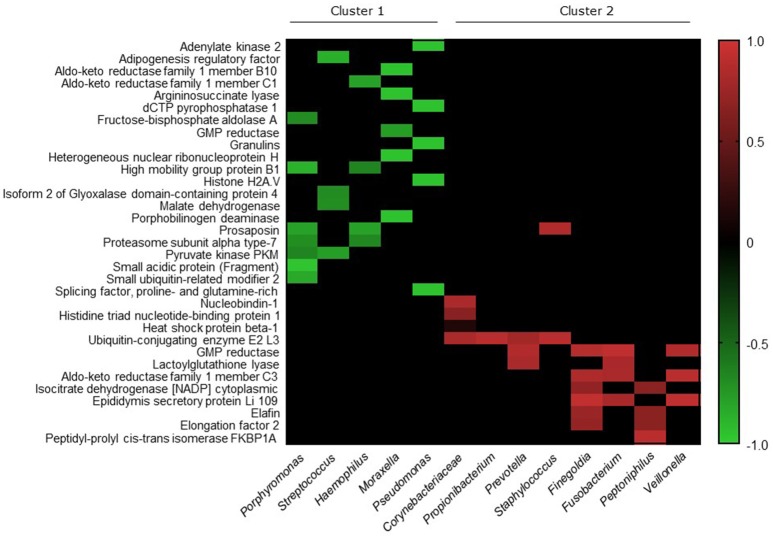
Figure 6.
Heatmap depicting the Spearman correlation scores for pairwise comparisons. The top 17 bacteria, with all other bacteria grouped into “Others,” and 104 proteins that were significantly lower in CRS cohort, were analyzed for correlations using Spearman correlation test. Significant correlations were identified between 13 bacterial genera/families and 33 proteins, which are represented in the figure. Ordering of proteins (rows) and bacterial genera/families (columns) were determined using average linkage hierarchical clustering of correlation scores based on Bray Curtis dissimilarity distance matrices. The clusters indicate bacteria and proteins that have more similar correlation scores. Heatmap values are shaded from green (+1) to red (−1) according to correlation scores. Non-significant pairwise associations are colored black.

