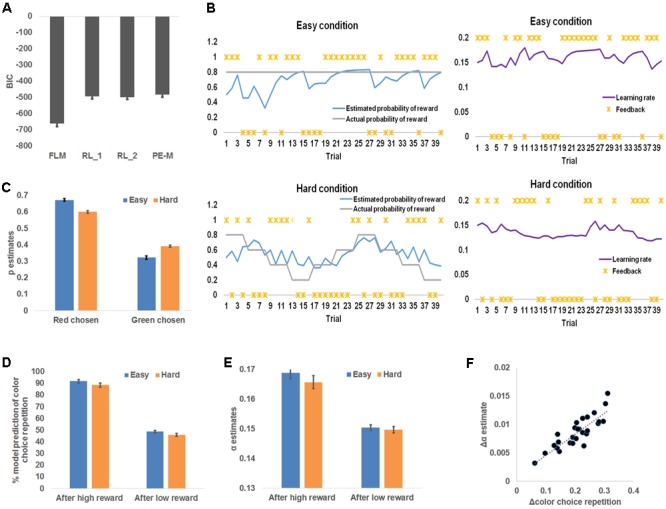
FIGURE 3.

Model-based behavioral results. (A) Model comparison results. From left to right, each bar represents group mean Bayesian information criterion (BIC) and mean standard error of the flexible learning model (FLM), reinforcement learning model with one (RL_1) learning rate and two (RL_2) learning rates (one for each level of difficulty), and a reinforcement learning model whose learning rate scales with the magnitude of prediction error (PE-M). (B) Sample time courses of the learning rate and the expected probability that high reward for the red square. The locations of asterisks indicate high or low reward received at each trial. (C) Model belief that red was the more rewarding color, plotted as a function of difficulty and the chosen color. (D) Model simulation of the percentage of choice repetition, plotted as a function of reward magnitude and difficulty. (E) Model belief of the learning rate, plotted as a function of reward magnitude and difficulty. (F) Individual increments of the probability of choice repetition (following high reward minus following low reward), plotted against the individual increments (following high reward minus following low reward) of the model estimates of the learning rate. The dotted line depicts the trend line.
