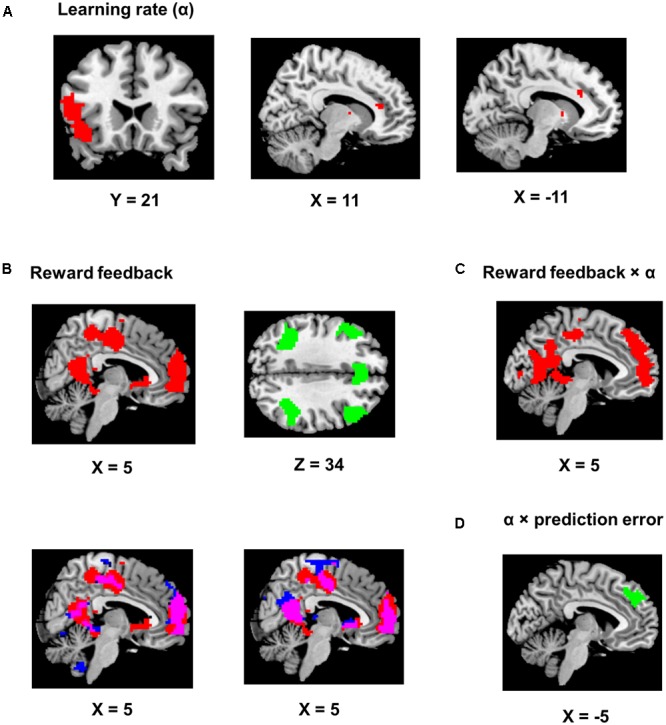
FIGURE 4.

Imaging results. Positive encoding and negative encoding are shown in red and green, respectively. The ch2bet template from mricron was used to be the reference brain to make figures from the statistical maps. (A) Encoding of the learning rate. The left panel shows the IFG/anterior insula region (P < 0.05, corrected). The two other panels show the dACC clusters (P < 0.001, uncorrected). (B) Encoding of the reward feedback (P < 0.05, corrected). The lower left panel shows the overlap (in purple) of the clusters in (A) and brain regions showing significantly stronger encoding of reward feedback than reward prediction error (in blue). The lower right panel shows the overlap (in purple) of the clusters in (A) and brain regions significantly encoding of reward feedback when the reward prediction error regressor was also included in the GLM (in blue). (C) Brian regions showing significant positive reward feedback × learning rate interaction (P < 0.05, corrected). (D) An MFC region showing significant learning rate × reward prediction error interaction (P < 0.05, corrected).
