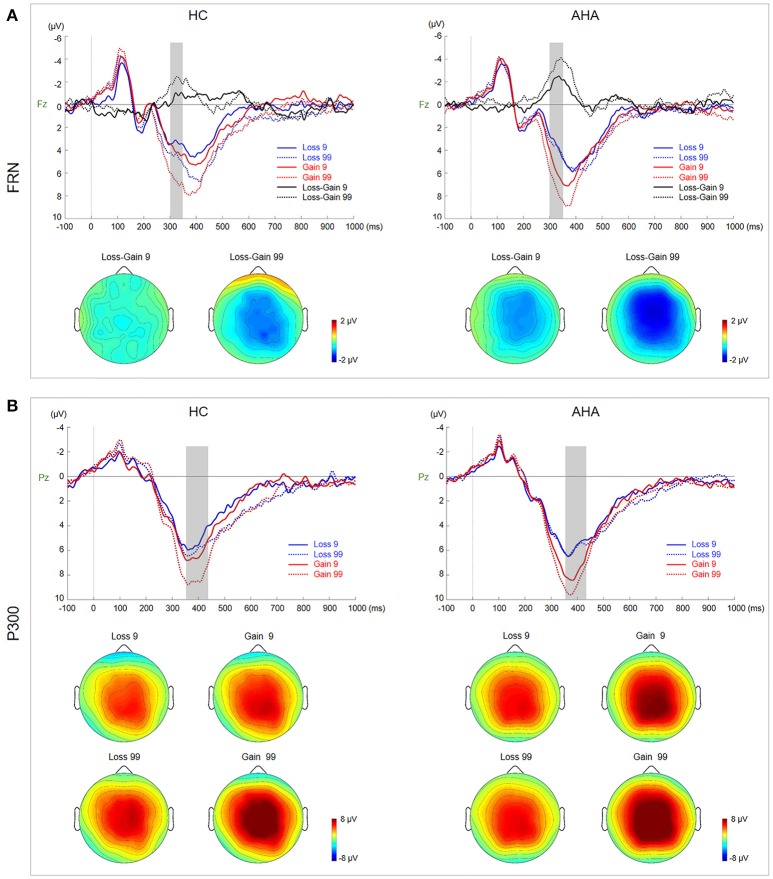
Figure 3.
Waveforms and scalp topographies of FRN and P300. (A) Grand average ERP waveforms for gain and loss by risk and sensation seeking at Fz. FRN (calculated as the difference between loss and gain waveforms) for low- and high-risk outcomes is shown with shaded areas depicting the time window. Scalp maps (290–350 ms) show the topography of the FRN component averaged across subjects and time windows. (B) Grand average ERP waveforms for gain and loss by risk and sensation seeking at Pz; the shaded area depicts the P300 time window. Scalp maps (360–420 ms) show the topography of the mean amplitude of the P300 time window.

