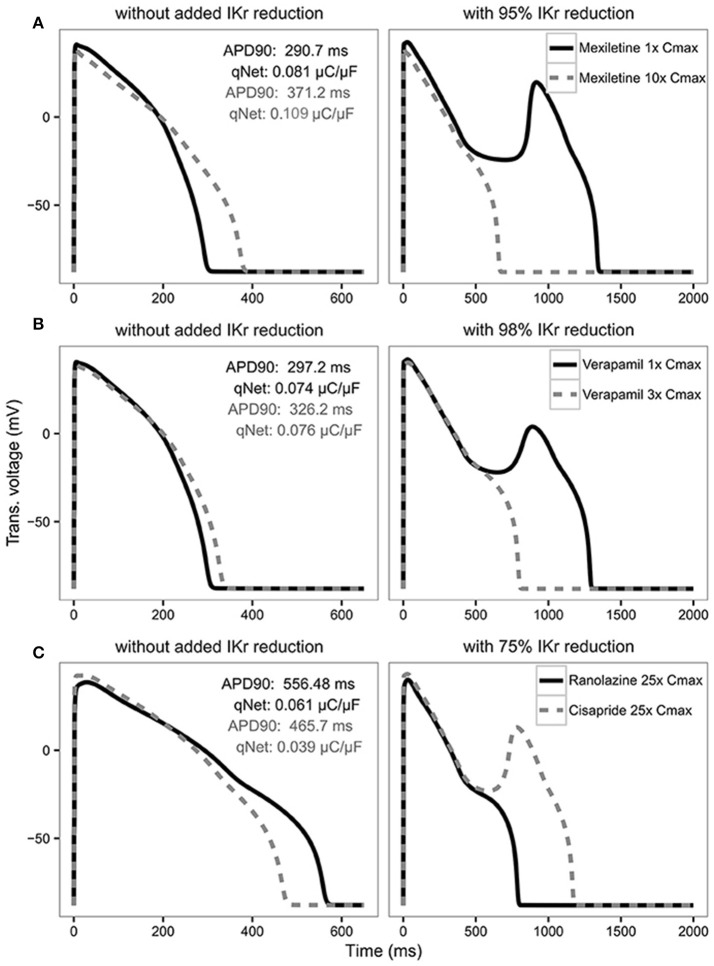
Figure 6.
AP traces for mexiletine (A) at 1x Cmax (black solid line) and 10x Cmax (gray dashed line) without (left panel) and with 95% IKr reduction (right panel); verapamil (B) at 1x Cmax (black solid line) and 3x Cmax (gray dashed line) without (left panel) and with 98% IKr reduction (right panel); and ranolazine (black solid line) and cisapride (dashed gray line) (C) at 25x Cmax without (left panel) and with 75% IKr reduction (right panel) for a CL of 2,000 ms. Corresponding APD90 (ms) and qNet (μC/μF) values are reported in black for mexiletine 1x Cmax, verapamil 1x Cmax and ranolazine 25x Cmax and in gray for mexiletine 10x Cmax, verapamil 3x Cmax and cisapride 25x Cmax. Note the IKr reduction (simulated by scaling the IKr maximum conductance) is applied in addition to the drug block effect and is used to assess the system's robustness against EADs (see Results section).

