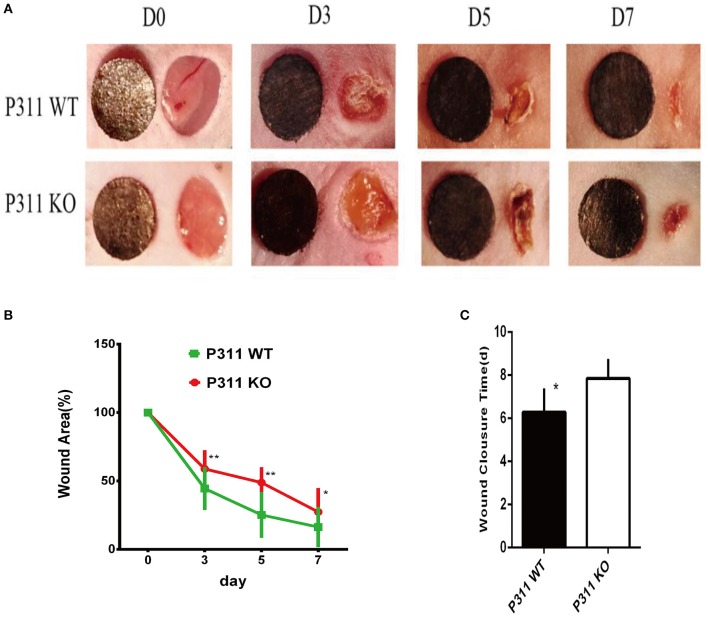
Figure 4.
Delayed wound healing in P311-null mice. (A) The macroscopic appearance of the wounds post-surgery at different time-points. (B) The amounts of wound healing at different time (n = 6 per group). (C) Wound closure times (n = 6 per group). Data were expressed as means ± SD. *P < 0.05, **P < 0.01, P311 WT vs. KO. The experiment was repeated for three times with reproducible results.

