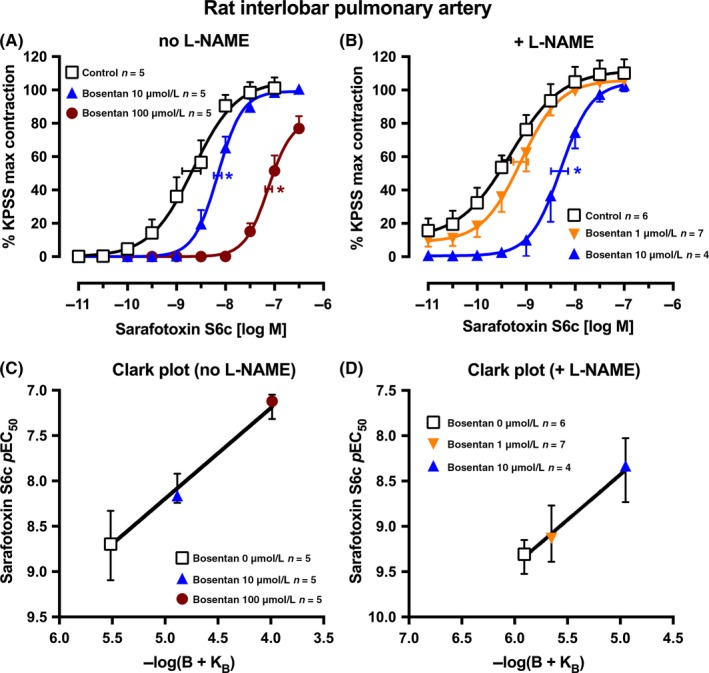
Figure 2.

Average single exposure concentration‐contraction curves to sarafotoxin S6c in rat pulmonary artery in the (A) absence or (B) presence of L‐NAME 100 μmol L−1 and of bosentan 0 (Control), 1, 10, or 100 μmol L−1. Data are expressed as % KPSS maximum contraction (y axis). Vertical error bars are ± 1 SEM (those not shown are contained within the symbol). Horizontal error bars represent the EC 50 ± 1 SEM. (C‐D) Clark plot displays for the corresponding figure panel above for the relationship between the sarafotoxin S6c pEC 50 values (y axis; −log M) and −log(B + KB) values (see legend for Figure 1C) in the absence (C) or presence (D) of L‐NAME. n, number of arteries isolated from separate animals. *P < .05, pEC 50 values compared with respective control (0 μmol L−1) pEC 50 values. Variations in n are due to violation of a predetermined criterion: arteries that contracted to KPSS with <1 mN force
