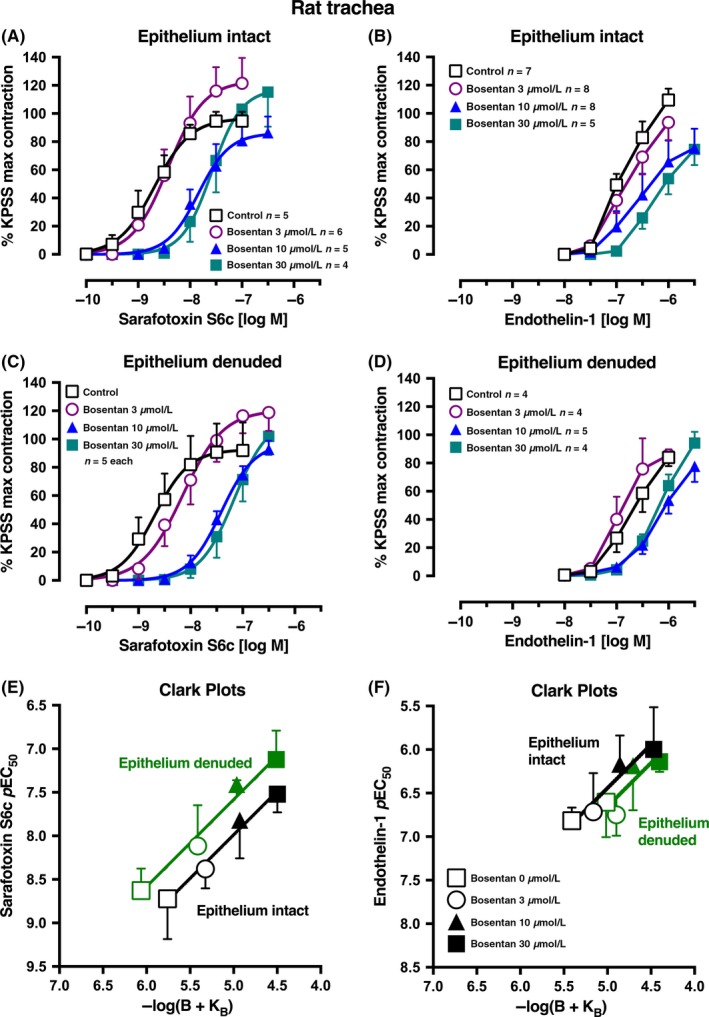
Figure 6.

Average single concentration‐contraction curves to (A) sarafotoxin S6c or (B) endothelin‐1 in rat isolated trachea with intact epithelium in the absence (Control, 0 μmol L−1) or presence of bosentan 3, 10, or 30 μmol L−1. (C‐D) Corresponding agonist curves in trachea with epithelium denuded. Data are expressed as % KPSS maximum contraction (y axis). Error bars in (A‐D) are ± 1 SEM (those not shown are contained within the symbol). (E‐F) Clark plot displays for the relationship in the rat trachea between the (E) sarafotoxin S6c or (F) endothelin‐1 pEC 50 values (y axis; −log M) and −log(B + KB) where B is concentration of bosentan (0, 3, 10, or 30 μmol L−1) and KB is the global‐fitted dissociation constant (see legend for Figure 1C). n, number of tracheal rings isolated from separate animals. Variations in n are due to violation of a predetermined criterion: tracheae that contracted to KPSS with <1 g force
