
Figure 7.
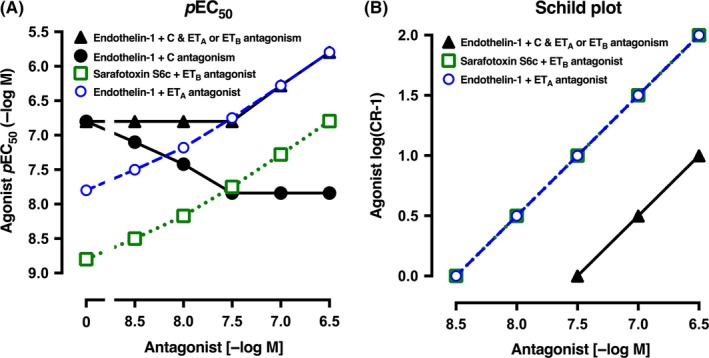
(A) Hypothetical relationship between the pEC
50 values for endothelin‐1 or sarafotoxin S6c concentration‐contraction curves and the concentration of a theoretical dual ETA and ETB receptor antagonist with a pKB of 8.5 at both receptors. For simplicity, the control (0 antagonist) pEC
50 for sarafotoxin S6c ( ) was set 1 log unit higher (10‐fold more potent) than for endothelin‐1 (
 ). In the presence of ETB receptors and the clearance (C) mechanism for endothelin‐1, the maximum clearance was set at 10‐fold (1 log unit) so that the pEC
50 in the presence of no antagonist (0) rises 1 log unit (● or ▲). As the ETB antagonism starts to block the endothelin‐1 clearance, so the pEC
50 rises (●) but just as does the ETB and ETA antagonism so that the resultant shows the actual pEC
50 is not altered. (B) The Schild plot for endothelin‐1 (or sarafotoxin S6c) as the agonist and the dual ETA and ETB antagonist with pKB of 8.5 is shown. Separate theoretical lines are shown for ETA (
). In the presence of ETB receptors and the clearance (C) mechanism for endothelin‐1, the maximum clearance was set at 10‐fold (1 log unit) so that the pEC
50 in the presence of no antagonist (0) rises 1 log unit (● or ▲). As the ETB antagonism starts to block the endothelin‐1 clearance, so the pEC
50 rises (●) but just as does the ETB and ETA antagonism so that the resultant shows the actual pEC
50 is not altered. (B) The Schild plot for endothelin‐1 (or sarafotoxin S6c) as the agonist and the dual ETA and ETB antagonist with pKB of 8.5 is shown. Separate theoretical lines are shown for ETA ( ; eg, rat aorta) and ETB (
 ; eg, trachea). In the presence of ETB‐mediated clearance (C) that removes endothelin‐1, as in pulmonary artery, the Schild plot points (▲) move parallel 1 log unit to decrease the potency of the dual antagonist by 10‐fold (ie, the pKB of 8.5 becomes 7.5). The y axis is the agonist log(concentration ratio–1) and the x axis shows the concentration of dual ETA and ETB antagonist (−log M)