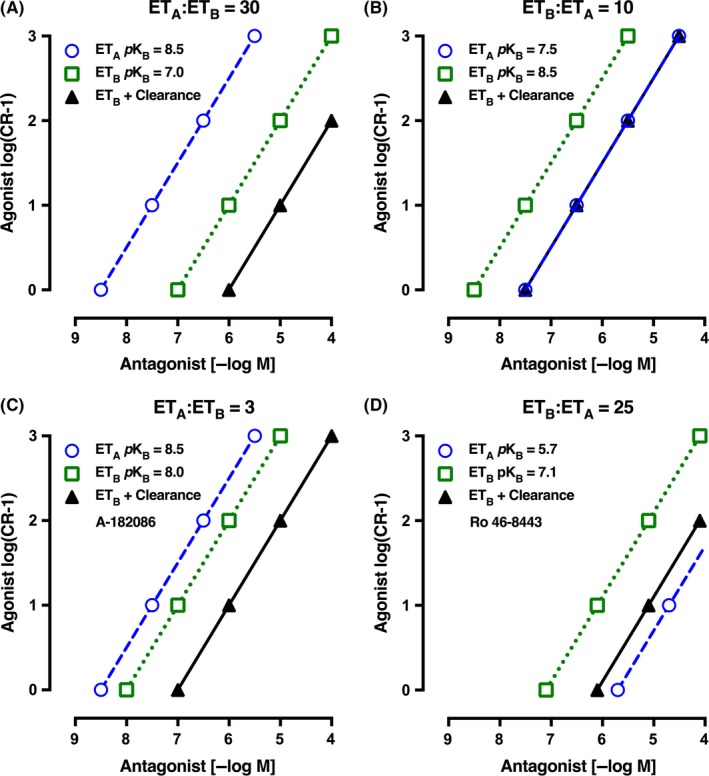
Figure 8.

(A) Schild plot for a theoretical endothelin‐1 antagonist that is 30‐fold more selective at ETA vs ETB receptors (pKB: ETA 8.5 and ETB 7.0). Note that in the presence of ETB‐mediated clearance, the plasma concentration of the dual antagonist must rise to 10 μmol L−1 to give a 10‐fold antagonism at ETB constrictor receptors and 3000‐fold antagonism at ETA constrictor receptors. (B) Schild plot for a theoretical endothelin‐1 antagonist that is 10‐fold more selective at ETB vs ETA receptors (pKB: ETB 8.5 and ETA 7.5). In the presence of ETB‐mediated clearance, the plasma concentration of the dual antagonist must rise to 0.3 μmol L−1 to give a 10‐fold antagonism at both ETB and ETA receptors. (C) Schild plot for endothelin‐1 antagonist A‐182086 that is threefold more selective for ETA vs ETB receptors (pKB: ETA 8.5 and ETB 8.0; see Table 1). In the presence of ETB‐mediated clearance, the plasma concentration of the dual antagonist must rise to 1 μmol L−1 to give a 10‐fold antagonism at ETB constrictor receptors and 300‐fold antagonism at ETA constrictor receptors. (D) Schild plot for endothelin‐1 antagonist Ro 46‐8443 that is 25‐fold more selective at ETB vs ETA receptors (pKB: ETB 7.1 and ETA 5.7; see Table 1). In the presence of ETB‐mediated clearance, the plasma concentration of the dual antagonist must rise to 7.9 μmol L−1 to give a 10‐fold antagonism at ETB receptors, with a fivefold antagonism at ETA receptors. The y axis is the agonist log(concentration ratio–1) and the x axis shows the concentration of dual ETA and ETB antagonist (−log M)
