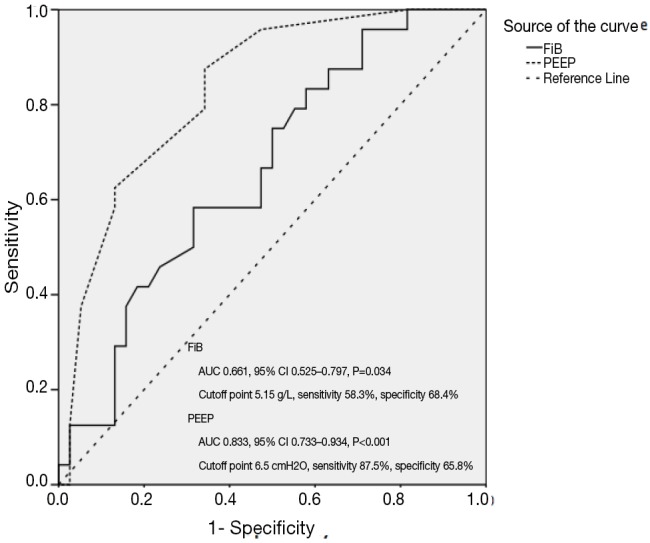
Figure 2.

ROC curves of FiB and PEEP in identifying risks for ARDS development in severe pneumonia. ROC curves show accuracy and power of FiB and PEEP in distinguishing patients at risk of ARDS from patients with severe pneumonia. The solid line represented FiB, while the dotted line represented PEEP. The AUC of FiB and PEEP was 0.661 (95% CI: 0.525–0.797, P=0.034) and 0.833 (95% CI: 0.733–0.934, P<0.001), and the cutoff point was calculated to be 5.15 g/L and 6.5 cmH2O with a sensitivity of 58.3% and 87.5% and a specificity of 68.4% and 65.8%, respectively. ARDS, acute respiratory distress syndrome; AUC, area under the curve; CI, confidence interval; FiB, fibrinogen; PEEP, positive end-expiratory pressure; ROC, receiver operating characteristic.
