Figure A2.

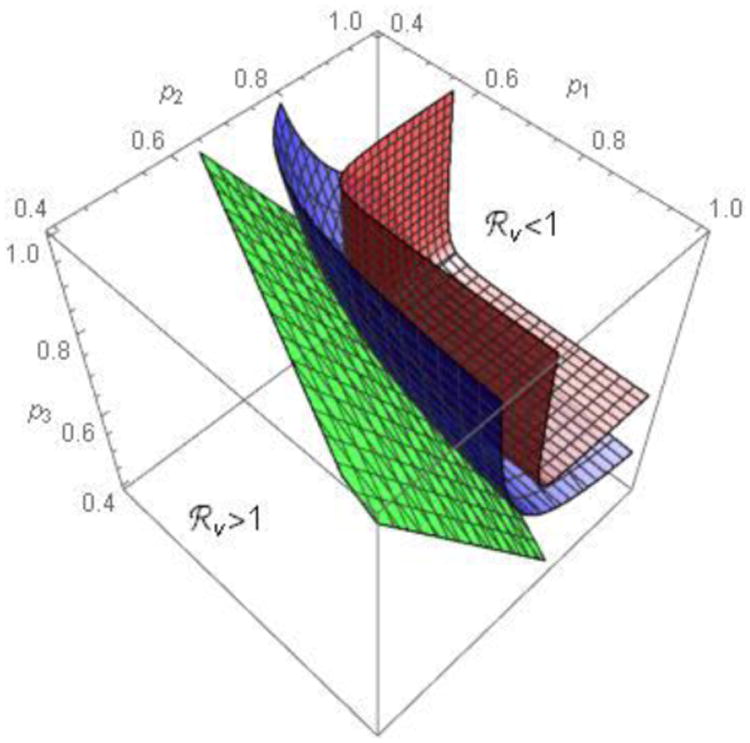
Contour surfaces for 3 sub-populations. The surfaces are for ε⃑ = 0 (bottom), ε⃑ = 0.4 (middle) and ε⃑ = 0.8 (top). Other parameter values are the same as in Figure A1.

Contour surfaces for 3 sub-populations. The surfaces are for ε⃑ = 0 (bottom), ε⃑ = 0.4 (middle) and ε⃑ = 0.8 (top). Other parameter values are the same as in Figure A1.