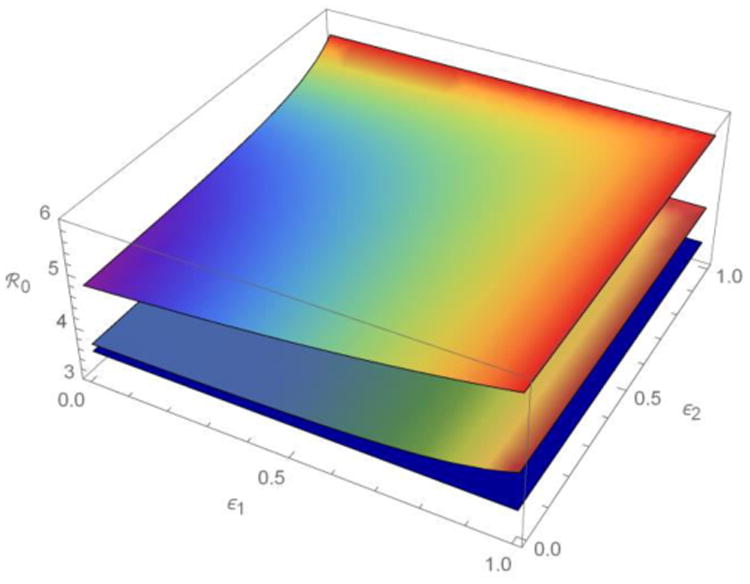
Figure 2.

The meta-population ℜ0 as a function of fractions of the contacts that members of two sub-populations reserve for others within their own sub-populations (ε1, ε2) when their activities (average contact rates) are more or less heterogeneous. ℜ0 decreases from the top surface (a1 = 4, a2 = 16), through the middle (a1 = 8, a2 = 12), to the bottom (a1 = a2 = 10). See table 1 for other parameter values. As heterogeneity in ε(e.g., ratio of the variance and mean) increases away from the line ε1 = ε2, heterogeneous preferential mixing also increases ℜ0.
