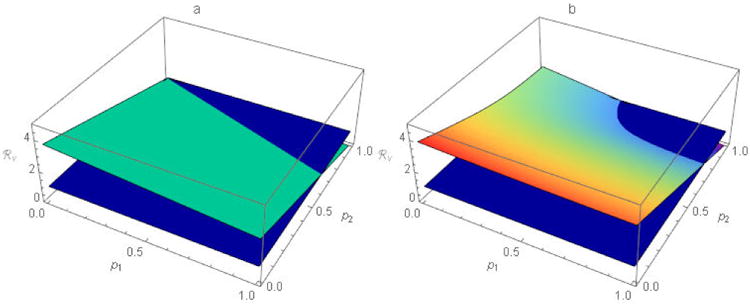
Figure 3.

The function ℜv for scenario B of table 1 with a) proportional, and b) preferential, mixing. The dark blue planes represent ℜv = 1 and the lighter blue plane and curved (rainbow) surface represent ℜv for other tabulated parameters at all possible (p1, p2) pairs when a) ε1 = ε2 = 0 and b) ε1 = ε2 = 0.5, respectively. ℜv ≤ 1 for all combinations of pi (i=1, 2) at or below the dark blue plane. While there is no single population-immunity threshold when n > 1, ℜv retains its utility as a threshold for outbreak prevention and, ultimately, disease elimination.
