
Figure 4.
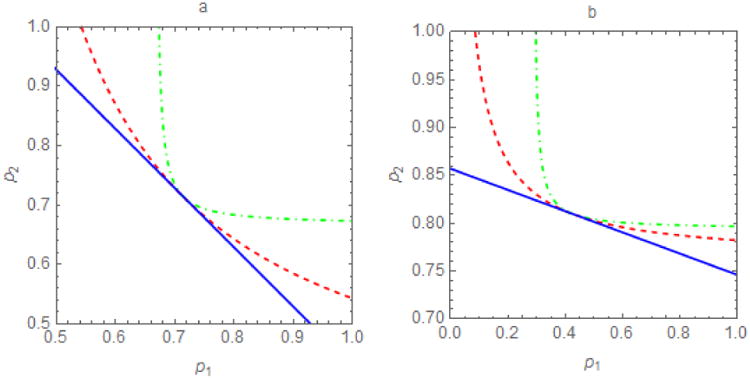
Contour plots of the threshold ℜv = 1 in the p1-p2 plane for different per capita contact rates, a, and proportions within-group, ε. For proportional mixing (ε⃑ = 0), the threshold pairs (p1, p2) for outbreak prevention or control form a (dark blue) line, p2 = −bp1 + r, where r > 0 is a constant and b=1 when a) sub-populations are identical in characteristics affecting ℜ0 (here a1 = a2 = 10) and b) b≠1 when they differ (here a1 = 5, a2 = 15). At the other extreme, isolated sub-populations (ε⃑ = 1), the region in which ℜv < 1 is a rectangle. In between, dashed curves represent selected 0 < ε⃑ < 1 (red, ε1 = ε2 = 0.5; green, ε1 = ε2 = 0.75). These thresholds divide the plane into sub-regions such that ℜv >1 (ℜv < 1) below (above) the line or curve. Preferential mixing increases the difficulty of achieving ℜv =1. When ε= 1, pairs (p1, p2) must be within a relatively small rectangular area in the upper right quadrant. When ε = 0, pairs (p1, p2) need only be in the larger area above the solid line.