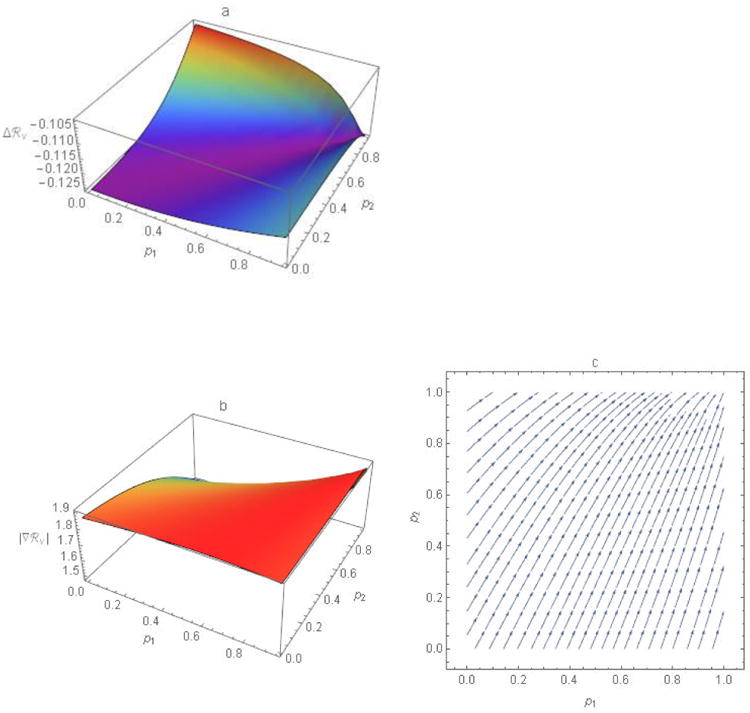
Figure 6.

The gradient, the n partial derivatives of ℜv with respect to the p-variables, and the magnitude and direction of this vector-valued function. a) The ASRΔℜv approximates the change in ℜv at points (p1, p2) corresponding to increases in Δp1 and Δp2, here both equal to 0.05. The more negative the value of Δℜv, the larger the reduction. b) Lengths, |∇ℜv|, or magnitudes of the gradient (i.e., rates of change in ℜv) at points (p1, p2). c) Directions of the negative gradient ∇ℜ at evenly spaced points (p1, p2) where arrows indicate the changes in p1 and p2 that would yield the greatest reductions in ℜv. Equivalently, at any point (p1, p2), increasing p1 and p2 in the direction of ∇ℜv would most efficiently (i.e., require the fewest doses of vaccine) achieve any particular Δℜv. See the text for derivation. Other parameter values are ε1 = 0.3, ε2 = 0.1, a1 = 5, a2 = 10, N1 = 750, and N2 = 250.
