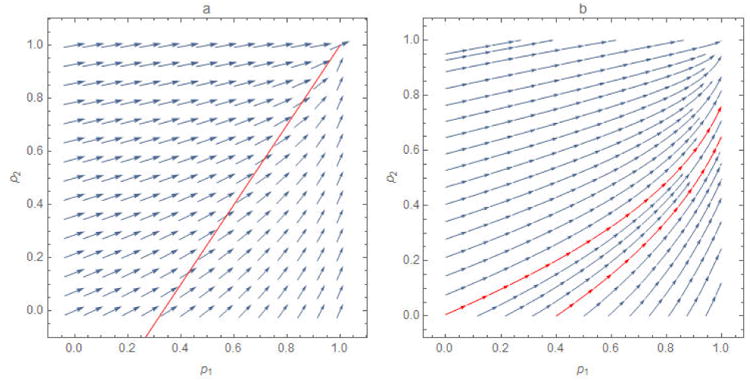
Figure 7.

The a) negative gradient ∇ℜ at evenly spaced points (p1, p2) and b) optimal path from arbitrary starting points for a modification of the example of Fine et al. solely to increase transparency. The arrows in figure 7a, a vector plot, indicate the changes in p1 and p2 that would yield the greatest reductions in ℜv, represented by their sizes, while those in figure 7b, a stream plot, indicate only direction. Because these two sub-populations are not isolated, the gradient is defined over the entire parameter space. And, because their contact rates are not as disparate as those of Fine et al., the gradient directions do not seem to be either horizontal or vertical.
