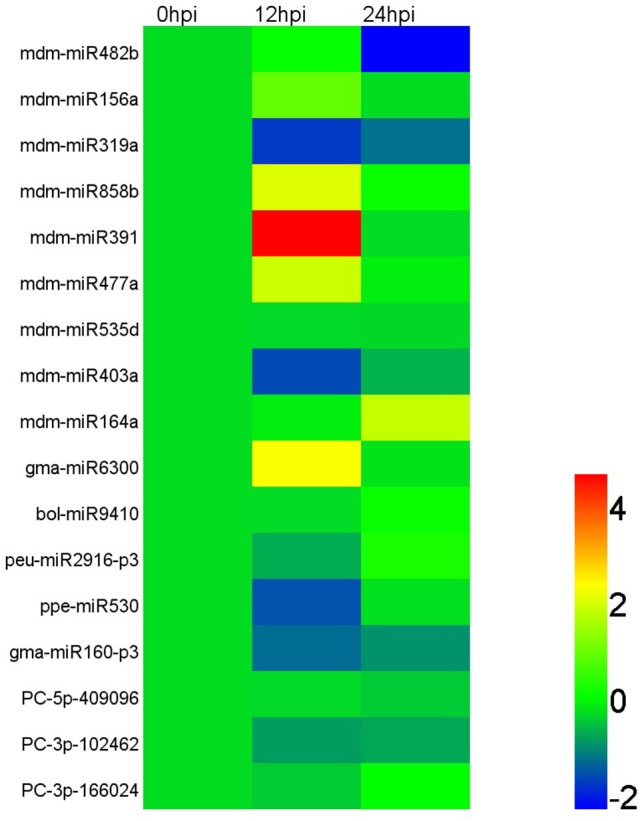
Figure 4.

Relative expression of miRNAs in apple twig bark tissue—V. mali interaction. According to the sequencing read number, 17 miRNAs were selected for transcript accumulation analysis in apple twig bark tissue after challenge with V. mali (12 and 48 hpi). The relative expression level of the miRNAs in the V. mali-inoculated plants at each time point was calculated as the fold-change of the mock-inoculated plants at that time point using the comparative 2−ΔΔCT method. The value of Log2 fold-change is used to construct the heat map. Different colors indicate the relative expression level of different miRNAs during the infection progress of Vm to apple twigs.
