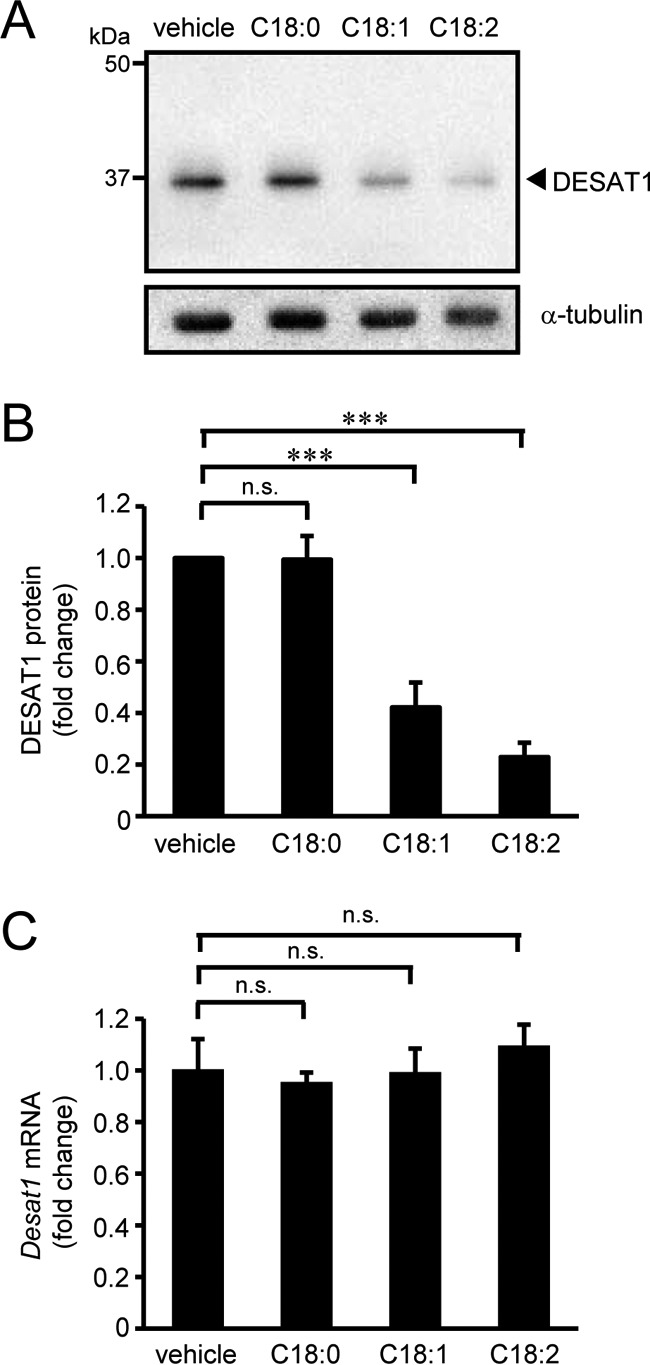
Figure 1.

Effect of unsaturated fatty acids on DESAT1 expression. S2 cells were treated with indicated fatty acids (100 μm) for 6 h, and the amounts of DESAT1 and α-tubulin (loading control) proteins were detected with anti-DESAT1 antibody and anti-α-tubulin antibody, respectively (A and B). Band intensities were determined by ImageJ software, and levels of DESAT1 proteins are shown relative to the amount of DESAT1 protein in vehicle-treated cells (B). S2 cells were treated with indicated fatty acids (100 μm) for 6 h, and the expression levels of Desat1 mRNA were determined by real-time PCR (C). Mean ± S.D. (n = 3). ***, p < 0.001; n.s., not significant.
