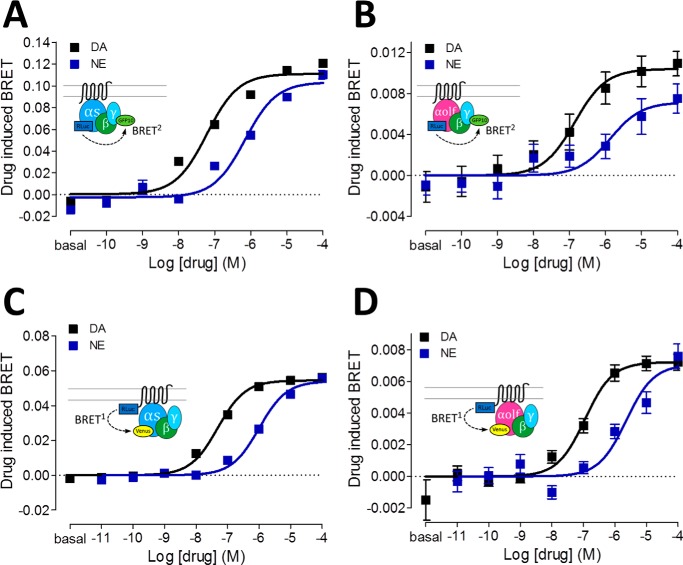
Figure 4.
A and B, dose-response curves of Gs (A) or Golf (B) protein activation BRET for D1R with dopamine (black curve) or norepinephrine (blue curve). C and D, dose-response curves of dopamine (black curve) or norepinephrine (blue curve) induced BRET between D1R-Rluc and Gs-Venus (C) or Golf-Venus (D). Corresponding schemes are illustrated in insets. The dose-response curves represent the means ± S.E. of more than five experiments performed in triplicate. DA, dopamine; NE, norepinephrine.

