Figure 1.
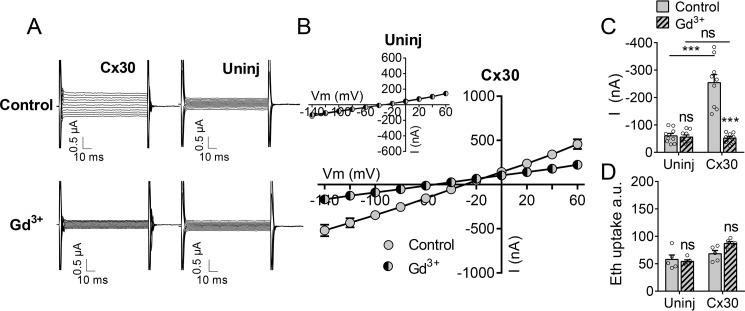
Activity of Cx30 hemichannels at physiological divalent cation concentrations. A, membrane currents were recorded by application of 100-ms voltage steps from +60 to −140 mV in steps of 20 mV from a holding potential of −50 mV in oocytes exposed to control solution (top panels) and after 1-min exposure to control solution containing 50 μm Gd3+ (bottom panels). Uninj, uninjected. B, summarized I/V curves for Cx30-expressing oocytes (n = 9) and uninjected oocytes (n = 9, inset). C, histogram of currents obtained at −80 mV in control solution (n = 9) and control solution containing 50 μm Gd3+ (n = 9). D, ethidium uptake recorded after 60-min exposure to control solution (n = 5) or control solution containing 50 μm Gd3+ (n = 5). Data in I/V curves and in the bar graphs are presented as mean ± S.E. The individual data points are shown by overlaid scatterplots in bar graphs. Statistical significance was tested using repeated measures two-way ANOVA with Bonferroni post hoc test and marked by asterisks above the columns when comparing control and Gd3+ within the two groups and with asterisks above the horizontal lines when comparing between the two groups. ***, p < 0.001; ns, not significant.

