Figure 5.
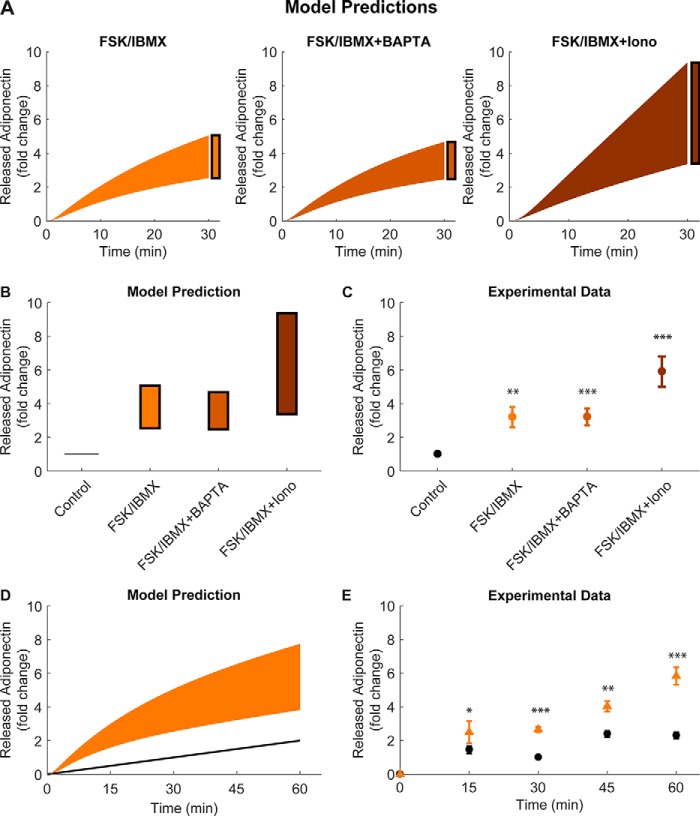
Developed model can predict adiponectin release levels at different time points. A, time-resolved predictions with uncertainties from simulations of the final model structure and the found acceptable parameters. In the simulated predictions, levels of cAMP, ATP, and Ca2+ were varied to reflect the experimentally added FSK/IBMX (left), FSK/IBMX in cells pre-treated with BAPTA (middle), and a combination of FSK/IBMX and ionomycin (Iono) (right). B, summary of the predicted adiponectin release intervals at time point 30 min in A. C, experimental data from Ref. 6 showing adiponectin release under the same conditions as simulated in B. D, time-resolved predicted adiponectin release after FSK/IBMX addition. E, experimental adiponectin release at the indicated time points (cf. simulations in D). Included concentrations were: 10 μm forskolin, 200 μm IBMX, and 1 μm ionomycin. Ca2+-chelated cells were pre-treated with 50 μm BAPTA during 30 min. *, p < 0.05; **, p < 0.01; ***, p < 0.001.

