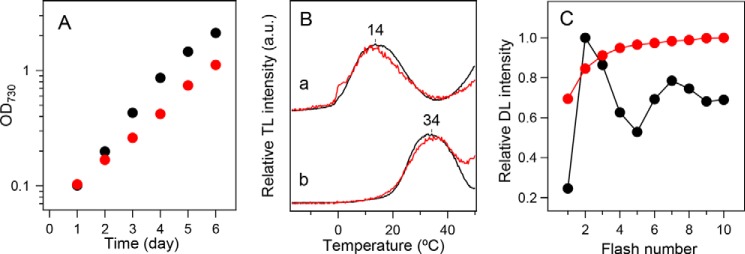
Figure 2.
In vivo characterization of WT* (black) and D1-N298A (red) cells. A, growth curves of cells. B, TL glow curves in the (a) presence and (b) absence of DCMU representing charge recombination of the S2QA− and S2QB− charged pairs, respectively. C, flush-number dependence of DL induced by 10 successive flashes (1 Hz). DL was measured at 25 °C and the amplitude at 0.8 s after each flash was plotted.

