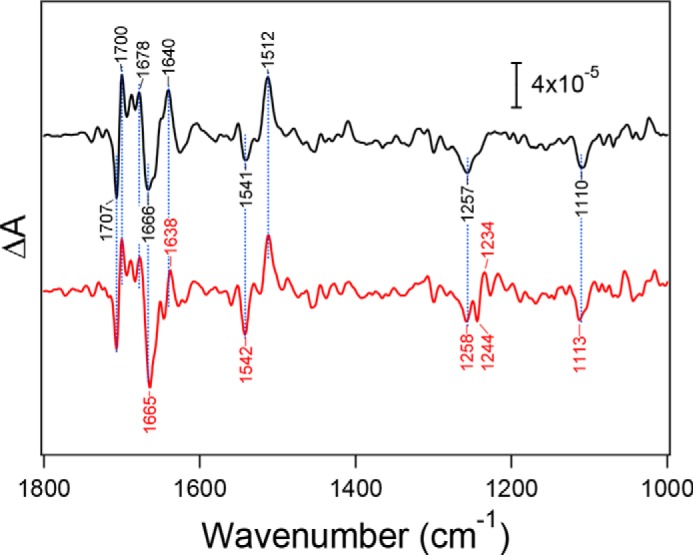
Figure 3.

Flash-induced FTIR difference spectra upon YZ oxidation of manganese-depleted PSII core complexes from WT* (black line) and D1-N298A (red line). Spectra were measured at 250 K. The spectrum of D1-N298A was scaled to adjust the intensity of the ferricyanide CN peak at 2116 cm−1 (not shown) to that in the WT* spectrum.
