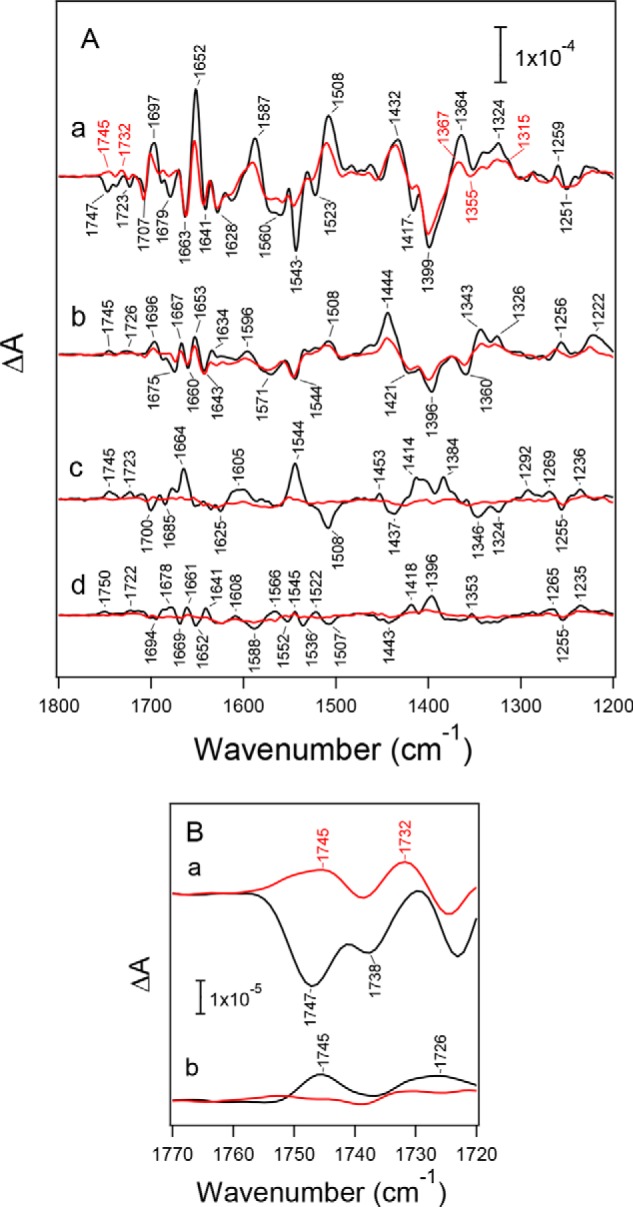
Figure 4.

Flash-induced FTIR difference spectra of the S-state cycle of PSII core complexes from WT* (black lines) and D1-N298A (red lines) in moderately hydrated films. A, mid-infrared region (1800–1200 cm−1) of protein vibrations. Difference spectra were measured upon the (a) first, (b) second, (c) third, and (d) fourth flashes. B, expanded view of the C = O stretching region of COOH groups (1770–1720 cm−1) at the (a) first and (b) second flashes. The spectra of D1-N298A were scaled with a factor to adjust the intensity of the ferricyanide CN peak at 2116 cm−1 (not shown) in the first-flash spectrum to that of WT*.
