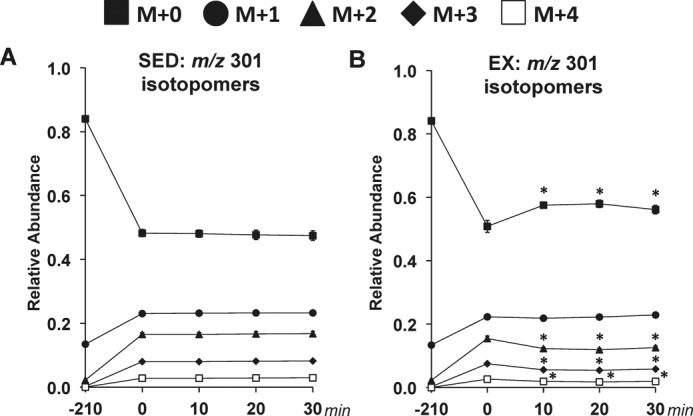
Figure 1.

Time course of MID of glucose fragment ions in sedentary and treadmill-running C57Bl/6J mice. A time course of the average, uncorrected relative abundance of m/z 301 isotopomers used in 2H/13C metabolic flux analysis is shown. A, m/z 301 isotopomers for SED mice. B, m/z 301 isotopomers for EX mice. M+n indicates the mass shift from the unlabeled state for a given fragment ion with M+0 to M+4 shown. Data are mean ± S.E. (error bars); n = 8–9 mice/group. *, p < 0.05 versus 0-min time point.
