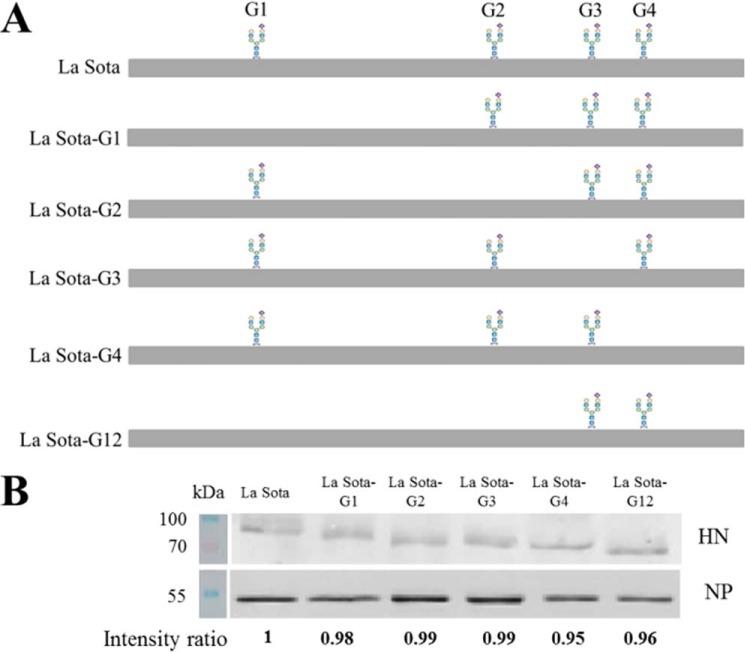
Figure 5.
Confirmation of the loss of N-linked glycans in HN mutant viruses. A, schematic diagram of the positions of the N-linked glycans in HN mutant viruses. RNA was extracted from the recovered mutant viruses; the fragments containing the mutant sites were amplified by RT-PCR using primers LaFull-F and LaFull-R and sequenced to confirm the presence of the introduced mutations in the HN mutant viruses. B, viral proteins extracted from parental and HN mutant viruses containing equivalent HAU were subjected to SDS-PAGE; the expression of HN and NP protein was detected by corresponding antibodies. The IRDye800DX-conjugated secondary antibodies were used, and the membranes were scanned using a LI-COR infrared imaging system with Odyssey software (Li-Cor Biosciences, Lincoln, NE). The densitometric intensity was determined using ImageJ; the level of HN protein was normalized by the expression of NP protein. The intensity ratios of La Sota-G1, La Sota-G2, La Sota-G3, La Sota-G4, and La Sota-G12 were normalized to the intensity of La Sota.

