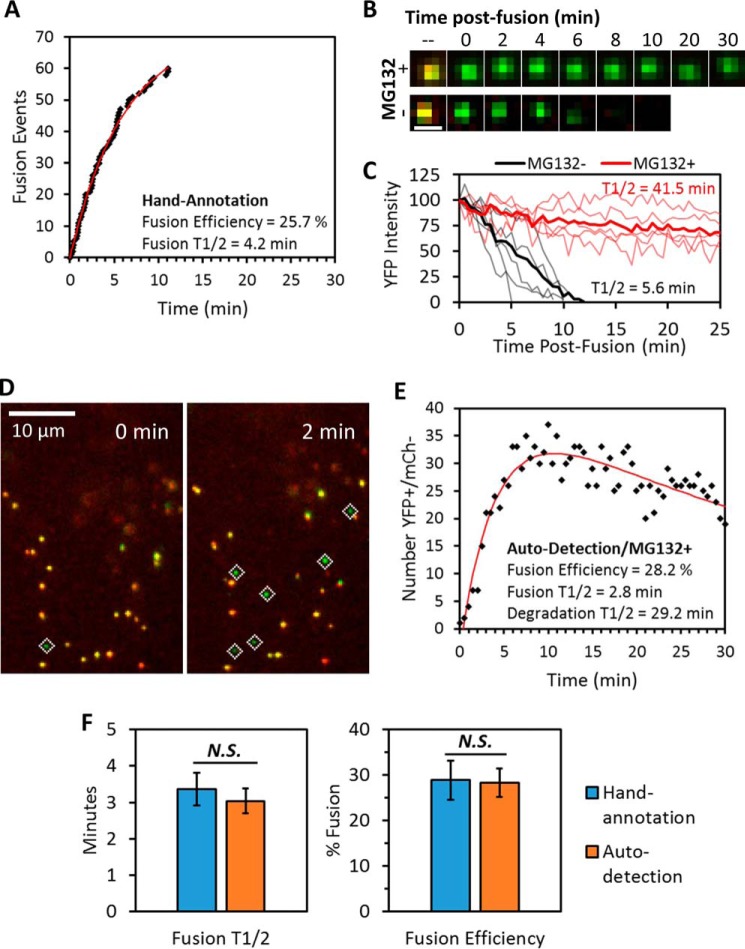
Figure 6.
Comparison of live-cell single-particle fusion characterized by either visual or computer-automated annotation. ASLV pseudoviruses labeled with the bifunctional marker were prebound to TVA950-expressing CV1 cells in the cold, and the temperature was shifted to 37 °C by addition of prewarmed buffer immediately prior to imaging. A, representative fusion kinetics obtained by manual annotation of a live-cell experiment. Fusion efficiency and half-time (t½) were found by curve-fitting to a single exponential model. B and C, imaging (B) and single-particle tracking (C) of post-fusion cores revealed that pretreatment of cells with 20 μm proteasome inhibitor MG132 drastically prolonged detection of post-fusion YFP signal (see also supplemental Movie S3). Degradation half-times were estimated from the ensemble average (thick lines) of single-particle YFP intensity traces obtained immediately after fusion (thin lines). Scale bar in B is 1 μm. D and E, high signal-to-noise imaging (see “Experimental procedures”) and MG132 treatment enabled robust automated detection of post-fusion viral cores in live cells (D). Fusion efficiency and the rate (t½) of YFP signal degradation were found by fitting the time course of number post-fusion viral cores to a double-exponential model described under “Experimental procedures” (E). F, comparison of fusion efficiency and t½ from manual and computer-automated annotation of live-cell single-particle fusion experiments. Error bars indicate standard error of five or more independent experiments. Because the exponential model estimates steady-state solution at time → ∞, the efficiency reported for visual annotations in E is slightly larger than that reported for the 30-min imaging window in Fig. 2C. N.S., not significant.

