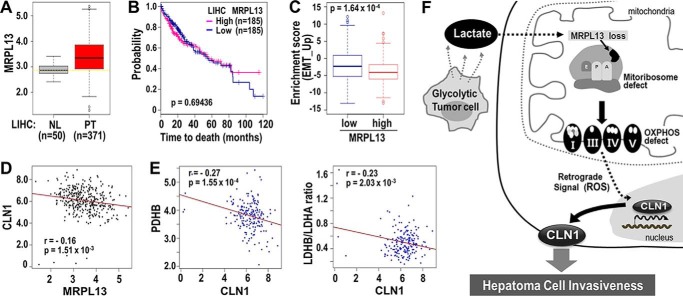
Figure 5.
Validation of clinical significance of MRPL13 in TCGA-LIHC. A, the expression level of MRPL13 in different tissue type was plotted. NL and PT indicate tissues from normal liver and primary tumor, respectively. **, p < 0.01 PT versus NL by Welch two-sample t test. B, Kaplan–Meier survival analysis was performed between MRPL13-high and MRPL13-low groups that were divided from 371 patients, based on the median value of MRPL13 expression level. The statistical p value was generated by the Cox–Mantel log-rank test. C, enrichment scores of EMT_UP genes were compared between MRPL13-low and -high groups. p value from Kolmogorov–Smirnov test of ssGSEA was transformed in log scale and used in the plot. D, association of MRP13 with CLN1 among the 371 patients was assessed by Pearson's product moment correlation test. E, association of CLN1 with PDHB (left panel) and the ratio of LDHB to LDHA (right panel) among the MRPL13 low group (n = 185) was assessed by Pearson's product moment correlation test. The ratio of LDHB to LDHA was calculated at individual sample level. Pearson correlation estimate, r, and p values were depicted. F, schematic diagram for our hypothesis explaining the underlying mechanisms of OXPHOS defect in hepatoma cell invasiveness.

